Ashley Furniture HomeStore banner showing the new Ashley logo and a redesigned brand look next to a lifestyle photo of a woman relaxing on a sofa
Case Study: E-Commerce UX / Retail Consulting
Rebuilding Confidence Into a Big-Ticket Purchase at Ashley Furniture

18%
Increase in customer retention after launch
35%
Reduction in average time-to-purchase
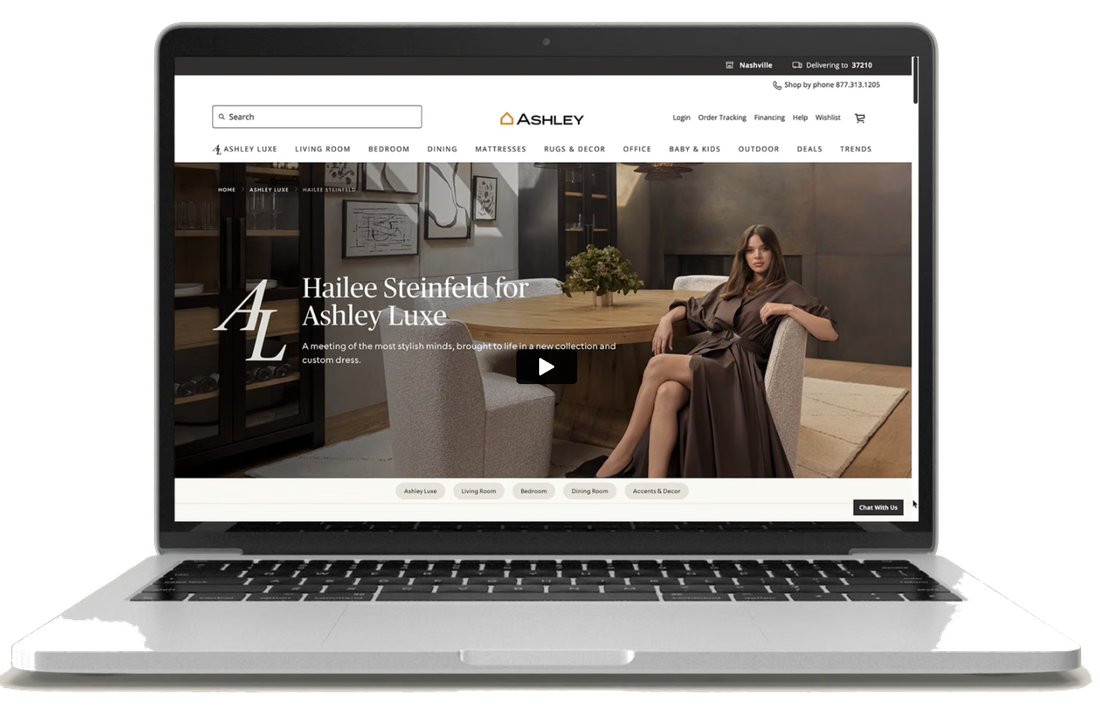
Ashley Furniture's live desktop site at the start of this project

Furniture is a purchase most people still want to touch before they commit, and checkout never built enough trust to replace that. This case study is about building that trust into a phone screen instead, across a catalog of thousands of SKUs, for one of the world's largest furniture retailers.

Ashley operates 2,000+ locations worldwide, serving online-first buyers and in-store shoppers who still browse online first. The redesign had to hold up across that catalog, across devices, and alongside a company-wide brand relaunch happening at the same time. That shaped nearly every decision that follows.

RoleSenior User Experience Designer & Product Designer
CompanyEPAM Systems
ClientAshley Furniture
Team4 designers · 5 engineers · PM · Product Owner
Duration30 weeks
My Role

As Senior User Experience Designer & Product Designer on EPAM Systems' Ashley Furniture account, I led strategy and design for Ashley's end-to-end e-commerce redesign, from product discovery through checkout and post-purchase tracking, at the head of a team of four (myself and one other UX designer, plus two UI designers), working alongside five engineers, a product owner, and a PM, with two business stakeholders reviewing key decisions.

The engagement ran 30 weeks, from early research through the launch of the redesigned site across web, mobile, and the native apps.

Focus: End-to-End E-Commerce Redesign · Tools: Figma, HotJar, UserTesting.com, LucidChart

Shoppers didn't trust what they couldn't touch

The brief that landed on my desk was about checkout. The data pointed further upstream: shoppers who couldn't find the right piece in Ashley's catalog never got far enough to decide whether they trusted checkout at all.

That moved the project's scope further upstream: to the product pages and the copy guiding people there, not just checkout. The brief had asked for a visual refresh; what actually shipped had to hold up across thousands of SKUs, on web, iOS, Android, and tablet, alongside a company-wide brand relaunch running in parallel, a moving target I didn't control.

Shopper Experience

Overwhelming catalogs without strong search or filtering made it hard to find the right piece. Buying something this size without touching it left shoppers wanting more proof (real photos, reviews, clear return policies) before they'd commit.

Business Impact

Every uncertain shopper was one who left to check a store in person, or abandoned the cart entirely, and a checkout that didn't clearly explain delivery added friction at the exact moment purchase intent was highest. Fixing that reliably lifts conversion, but only if the experience feels as trustworthy as walking the showroom floor.

What Complicated the Fix

  • A brand relaunch (new logo, new pricing model) shipping alongside the redesign
  • A catalog spanning furniture, mattresses, kids, outdoor, and decor, serving individual shoppers and B2B buyers alike
  • Orders could split between warehouse pickup and third-party shipping: terms like "curbside" and "doorstep delivery" meant different things internally than they did to shoppers
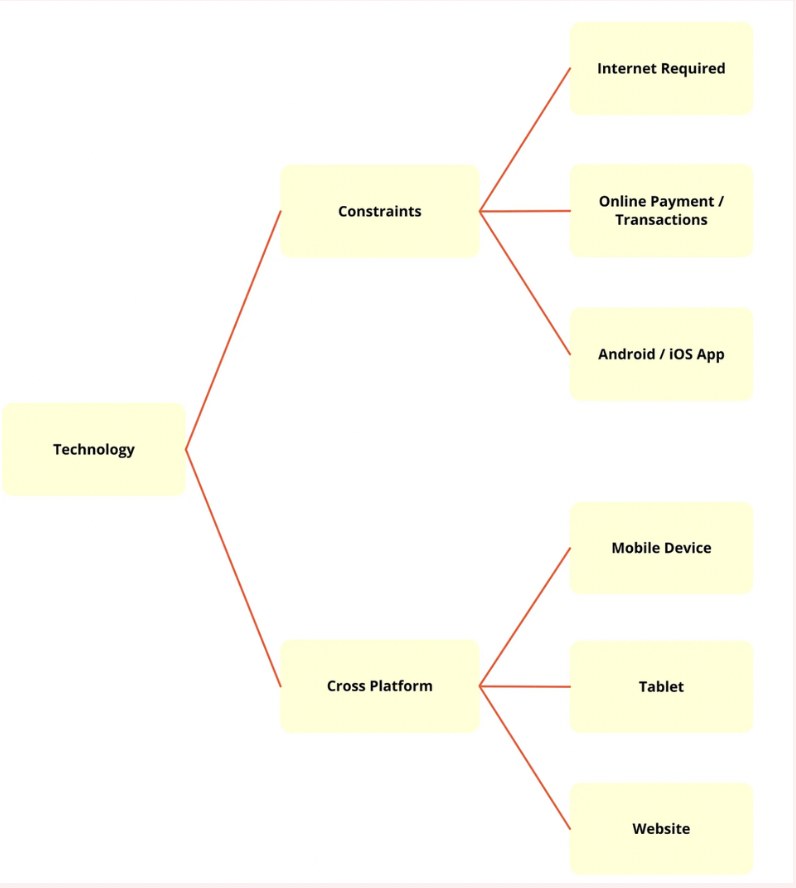
Technology constraints diagram: platform constraints (internet required, online payment, Android/iOS app) and cross-platform requirements (mobile device, tablet, website)

The platform constraints mapped at the start of the engagement, covering web, iOS, Android, and tablet.

Twelve conversations that reframed the brief

I combined quantitative surveys with 1:1 interviews and competitive benchmarking, testing whether the problem was really "the site looks dated," or something deeper: whether shoppers trusted what they saw enough to buy it.

What I assumed

Shoppers were leaving as soon as they landed because the visuals were confusing and checkout felt shady.

What I learned

People didn't want to spend long searching for what they needed, and they trusted a checkout that showed every step and cost.

User surveys 1:1 interviews Competitive benchmarking Affinity mapping
12
Users surveyed on shopping behavior and checkout confidence
~50%
Cited low trust in checkout as their reason for abandoning a cart
6
Competitors benchmarked, from direct furniture retailers to Amazon and Shein

What built trust

  • High-quality, real product imagery
  • Reviews, ratings, and Q&A before purchase
  • Clear return policies and shipping transparency
  • Fast, simple checkout flows

What caused friction

  • Large catalogs without strong search or filters
  • Checkout steps that didn't build confidence
  • Wanting in-store validation before big purchases
  • Unclear navigation between categories
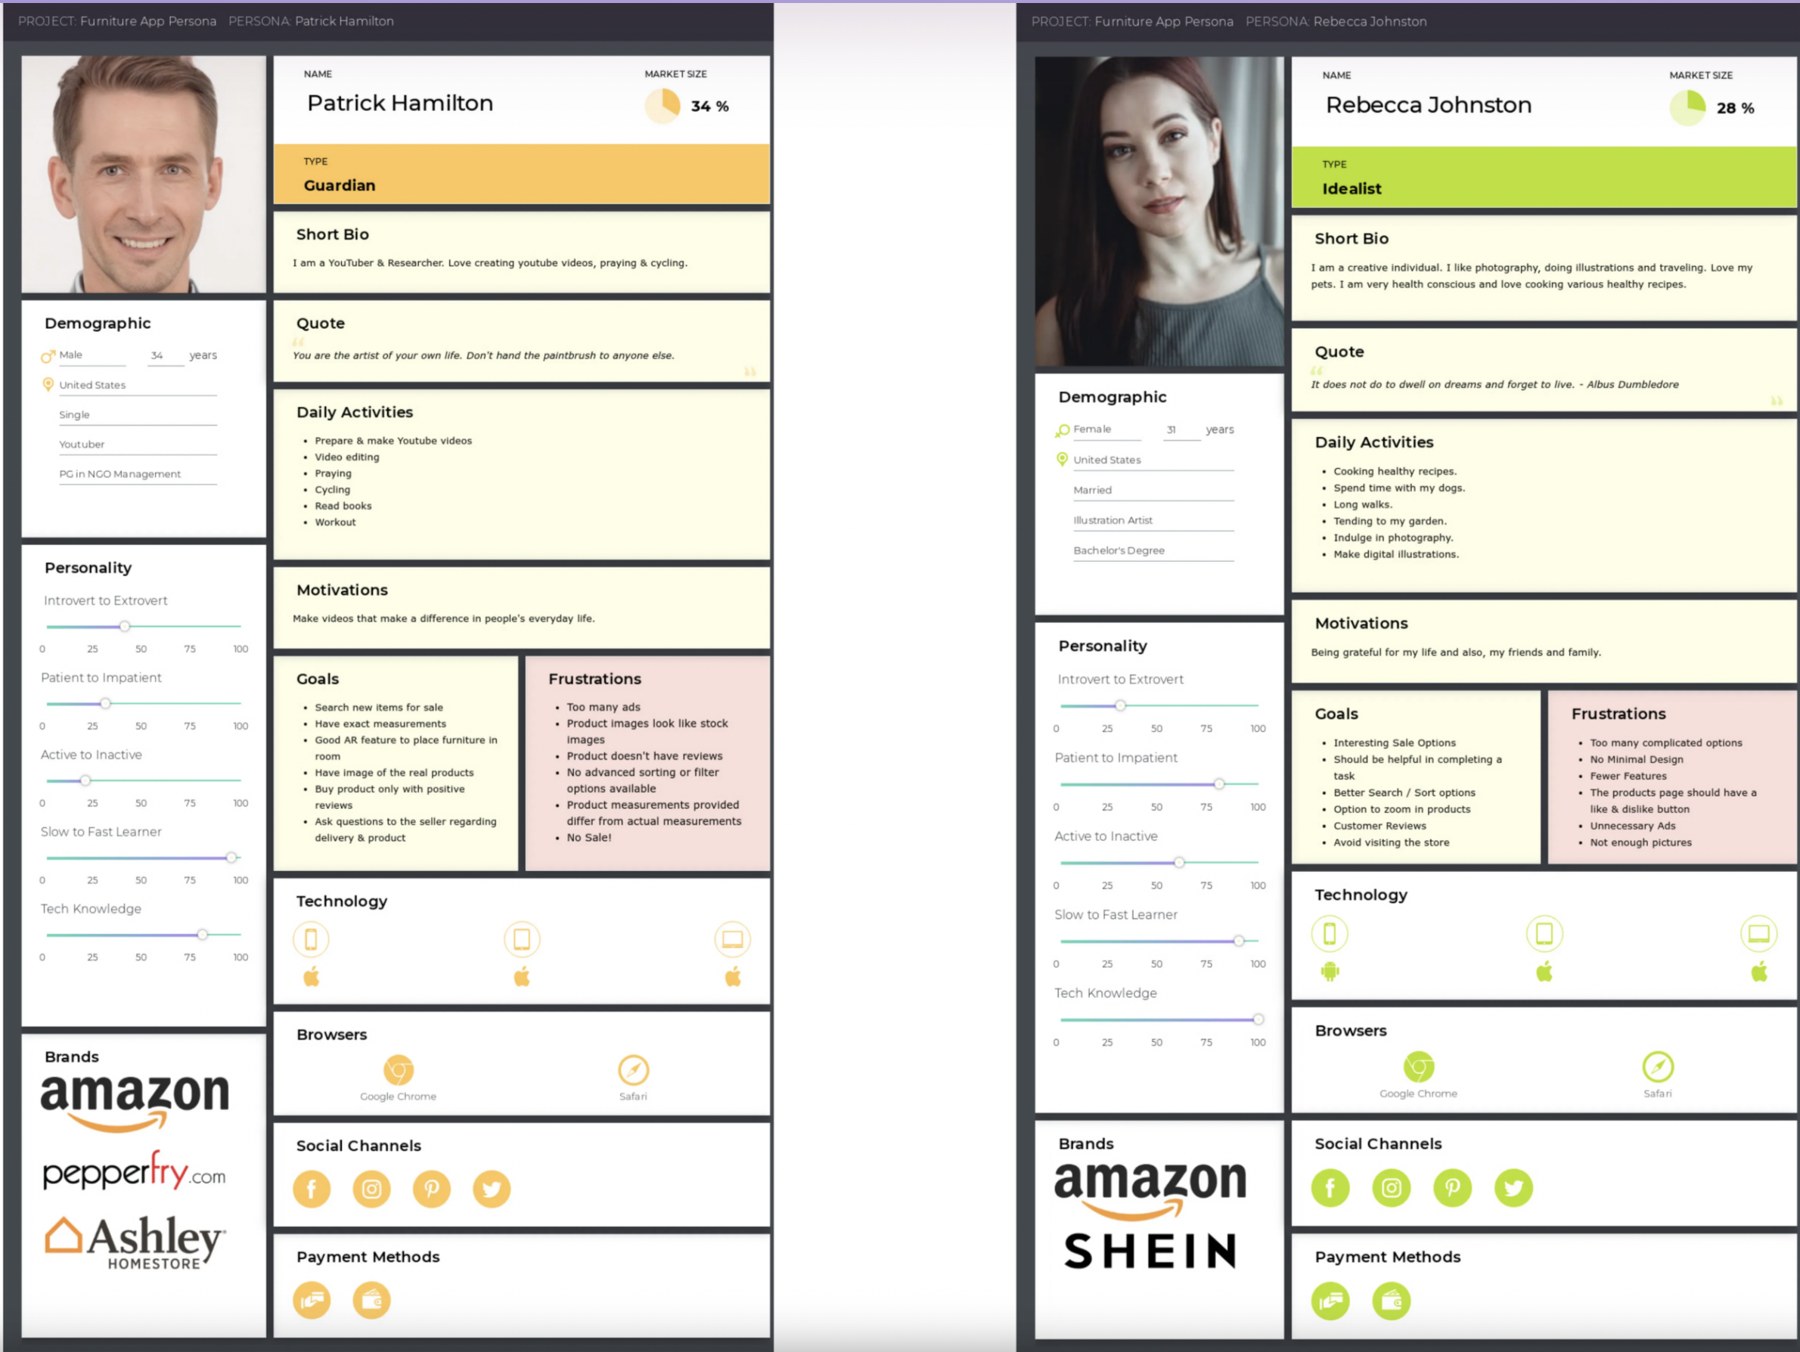
Two core user personas from research: Patrick Hamilton, a considered planner, and Rebecca Johnston, a faster-moving lifestyle shopper, with demographics, goals, and frustrations

Two of the core personas built from this research: Patrick, a considered planner who researches every purchase, and Rebecca, a faster-moving shopper guided by lifestyle and trust signals. Both shaped navigation, product page structure, and checkout decisions below.

One catalog, five different paths to checkout

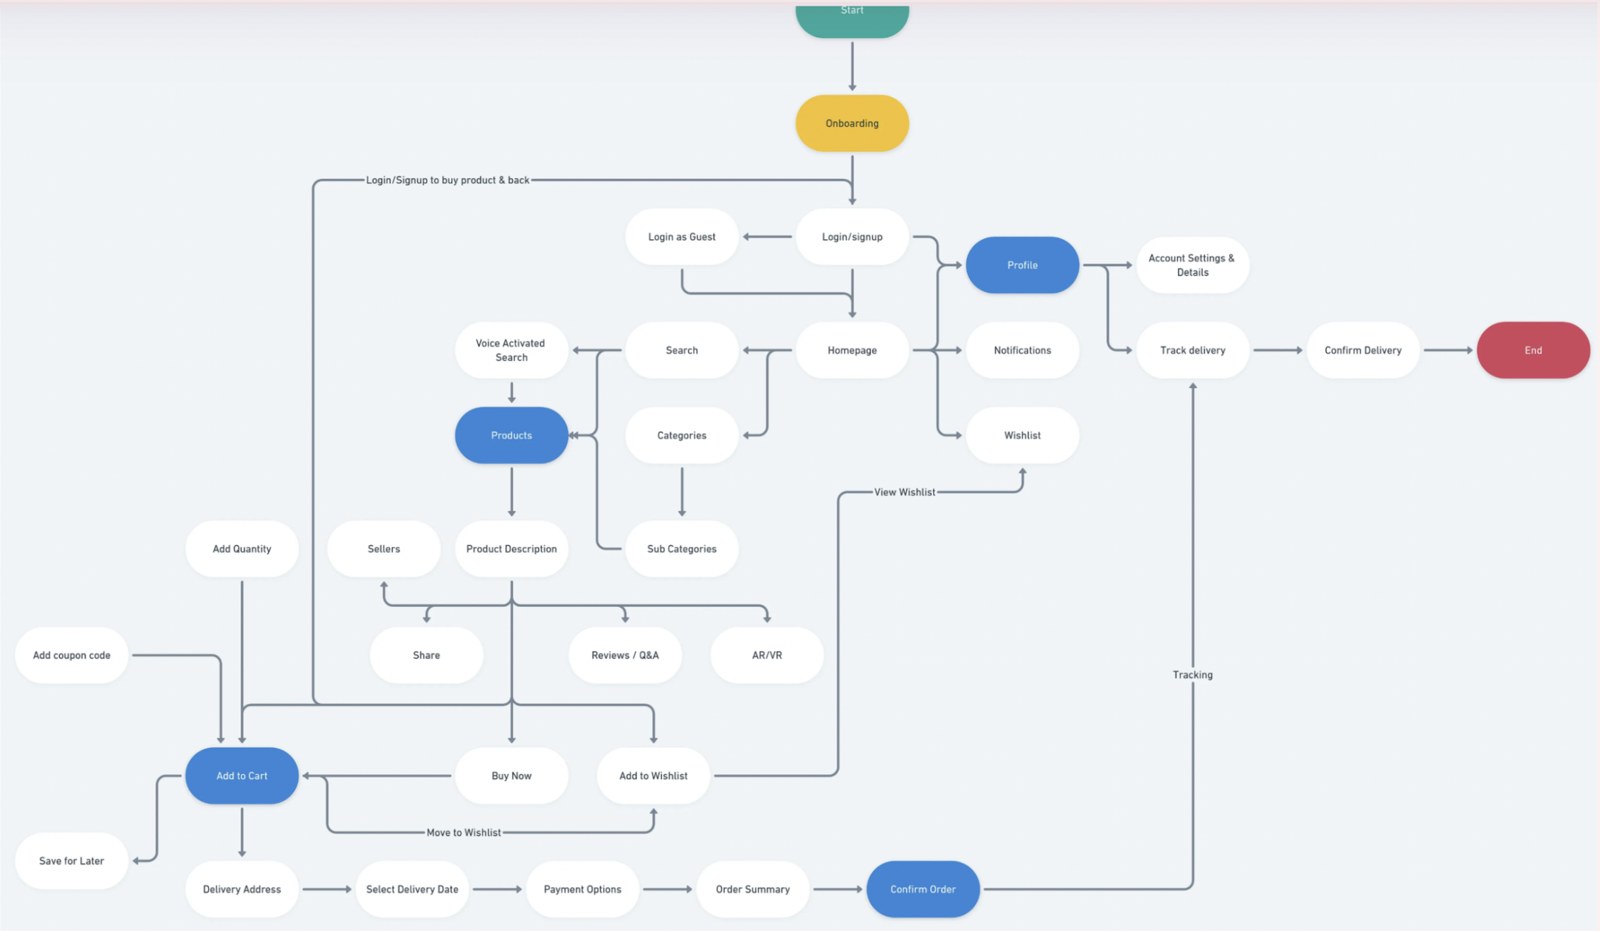
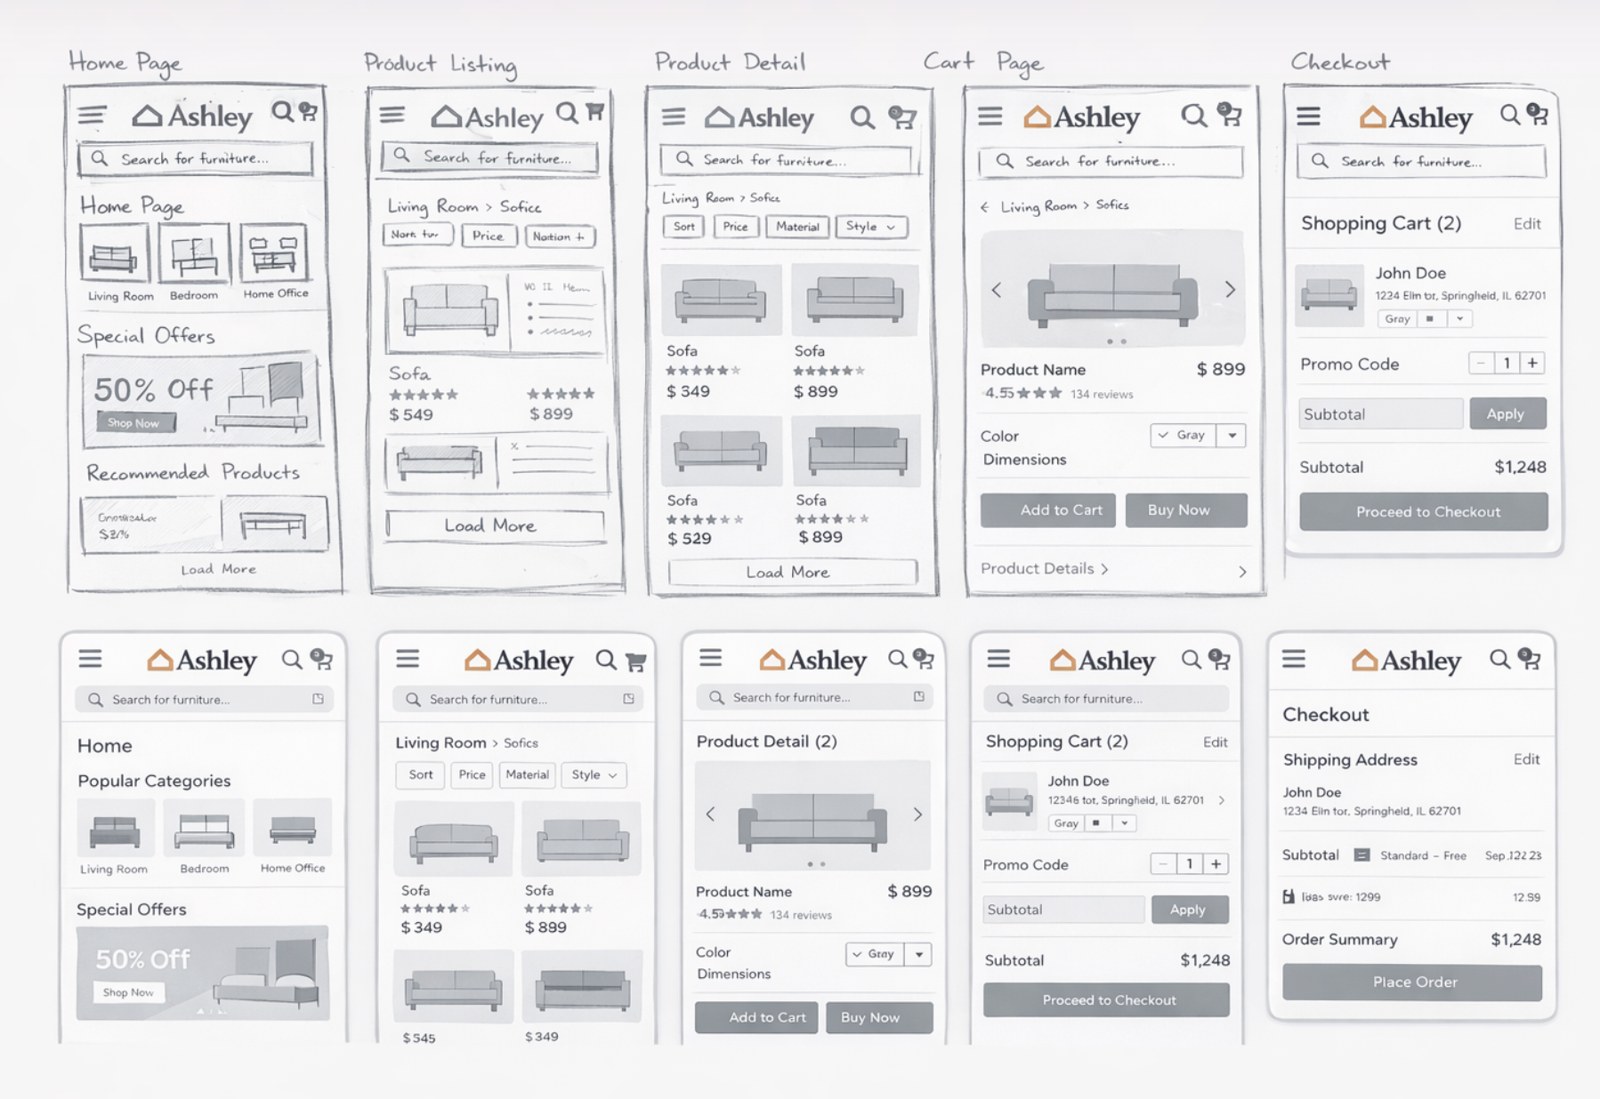
I mapped end-to-end flows in LucidChart across discovery, product exploration, cart, checkout, and delivery, including the mixed warehouse-and-shipping paths that later became the biggest source of confusion in testing. Those flows drove early low-fidelity wireframes across the full purchase journey.

End-to-end user flow diagram covering onboarding, search, product pages, cart, checkout, and delivery tracking

The validated end-to-end user flow.

Low-fidelity wireframes covering home page, product listing, product detail, cart, and checkout

The low-fidelity wireframes that flow drove, covering home, listing, product detail, cart, and checkout.

From 30% task completion to 90%

I recruited and tested the redesigned flows with 15 real users through UserTesting.com, completing real tasks: finding a product, comparing options, and checking out an order split between warehouse pickup and shipping.

HotJar complemented those sessions with recordings from the live site, showing where real shoppers hesitated or dropped off outside a test environment. The original flow's baseline task completion was 30%; after iterating on what testing surfaced, the redesigned flow reached 90%, with friction surfacing in only 8% of task attempts across the 15 sessions.

15
Real users in usability testing
30%
Baseline task completion, original flow
90%
Task completion, redesigned flow
8%
Of task attempts still hit friction after redesign

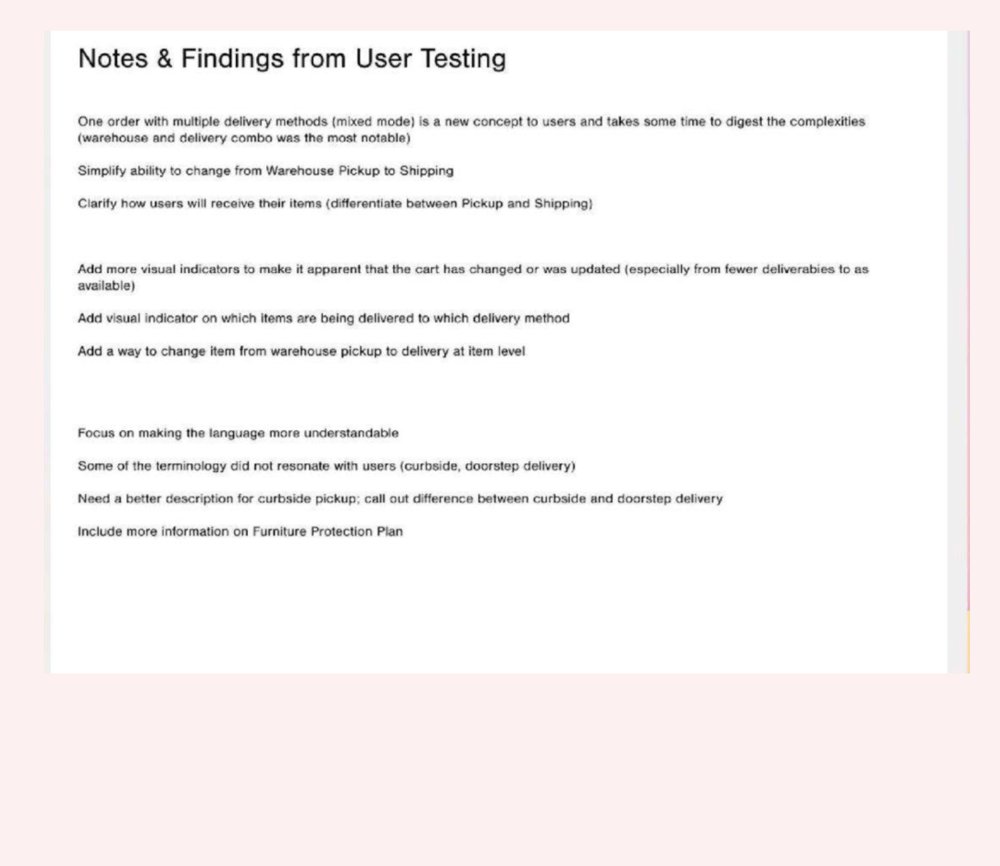
Key insight: almost all of the remaining friction traced back to one thing: Ashley's mixed fulfillment model.

A single order could split between warehouse pickup and third-party shipping, and internal terms like "curbside" and "doorstep delivery" didn't mean the same thing to shoppers that they meant inside the company. That's what the iteration below actually fixed.

Original usability testing notes and findings, listing friction points around mixed delivery methods, cart visibility, and delivery terminology

The original testing notes: the source behind the stats above.

Fewer categories, larger imagery, one clear next step

I decided to prioritize three things over a faster visual-only pass, all aimed at the same target: getting a shopper to trust what they couldn't touch. Larger product imagery to replace the physical inspection touch normally provides, a catalog that surfaced the right piece before a shopper gave up looking, and fewer, clearer next steps at every stage of the funnel. A visual-only pass would have shipped sooner, but it wouldn't have touched why people were actually abandoning carts.

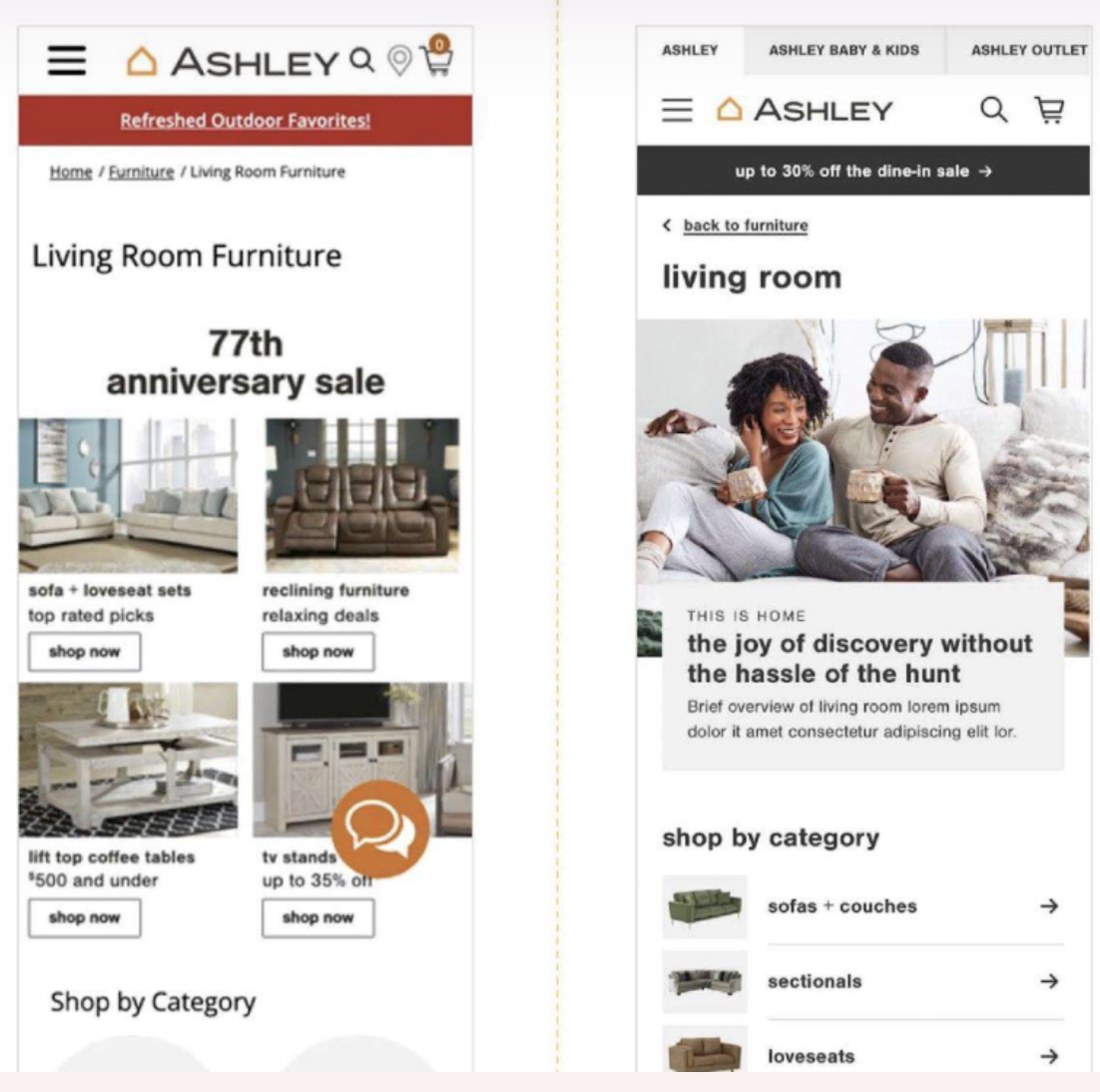
Category landing: current vs. redesign
Category landing page comparison: current Ashley site with a promotional grid versus the redesign leading with lifestyle imagery and simplified category navigation
Product listing: current vs. redesign
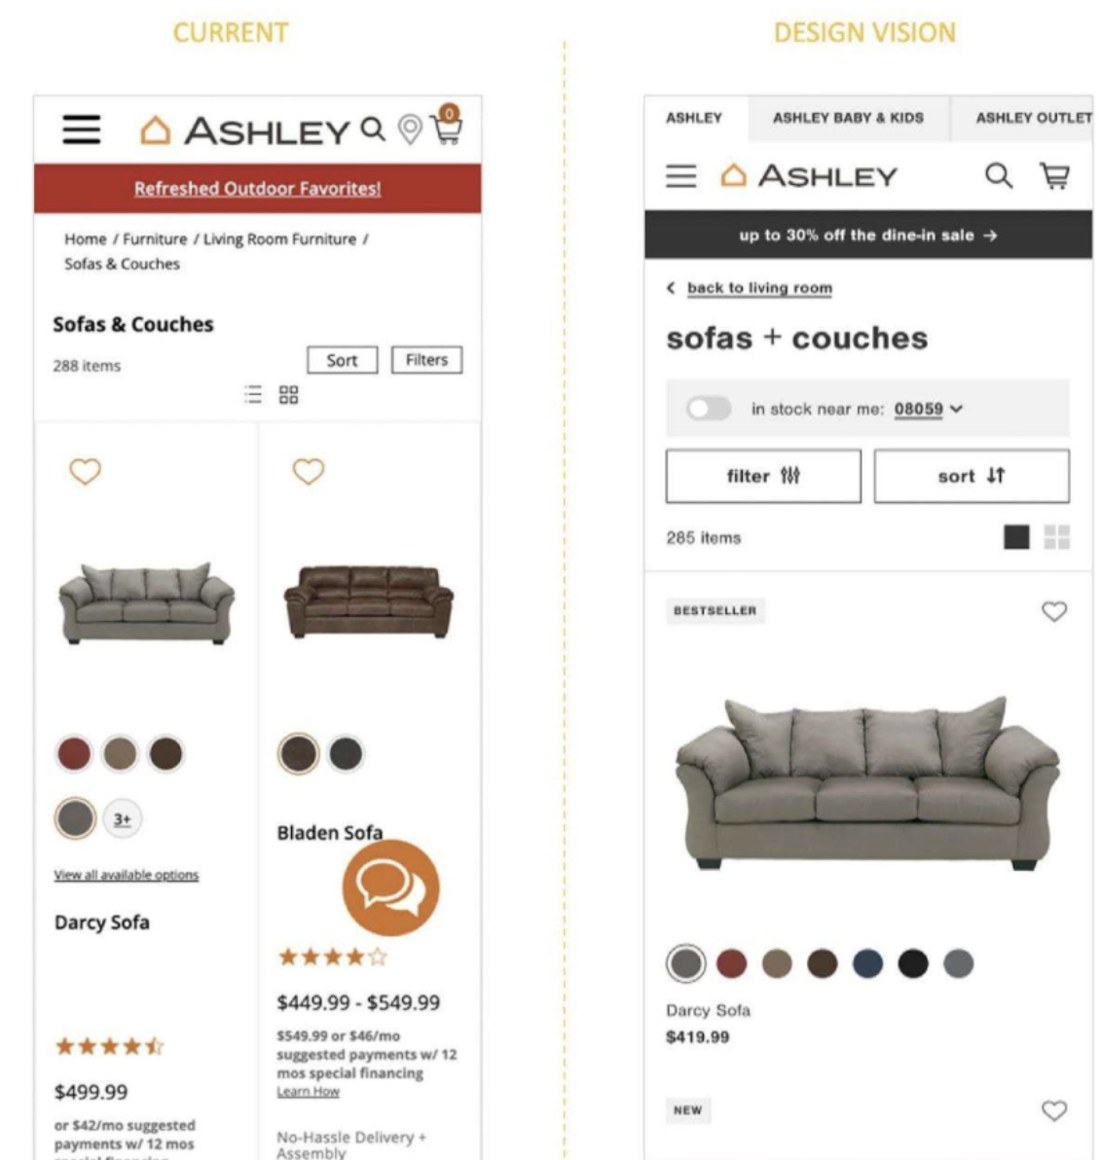
Product listing page comparison: current Ashley site versus the redesign with larger imagery, clearer filters, and simplified product cards

What changed

  • Simplified breadcrumbs and clearer section labels, replacing a promo banner competing for attention
  • Lifestyle photography leading each category, replacing a wall of promotional tiles
  • Larger, touch-friendly imagery and buttons on product listings
  • "Show more" replacing pagination, so browsing wasn't constantly interrupted

Closing the loop with research and testing

  • Checkout confidence: clearer visual indicators whenever the cart changed, and an explicit split between "delivered" and "pickup" items instead of one ambiguous total
  • Navigation: simplified category structure and stronger filtering, addressing the "hard to find things" complaint from about half of survey respondents
  • Delivery language: replaced "curbside" and "doorstep delivery" with plain, differentiated wording, and let shoppers change an item's fulfillment method at the item level instead of the whole order

The flow that took task completion from 30% to 90%

The redesigned path from product page to checkout: protection plans, financing, and a clear order breakdown, carried consistently across desktop and mobile.

Desktop: product page to checkout
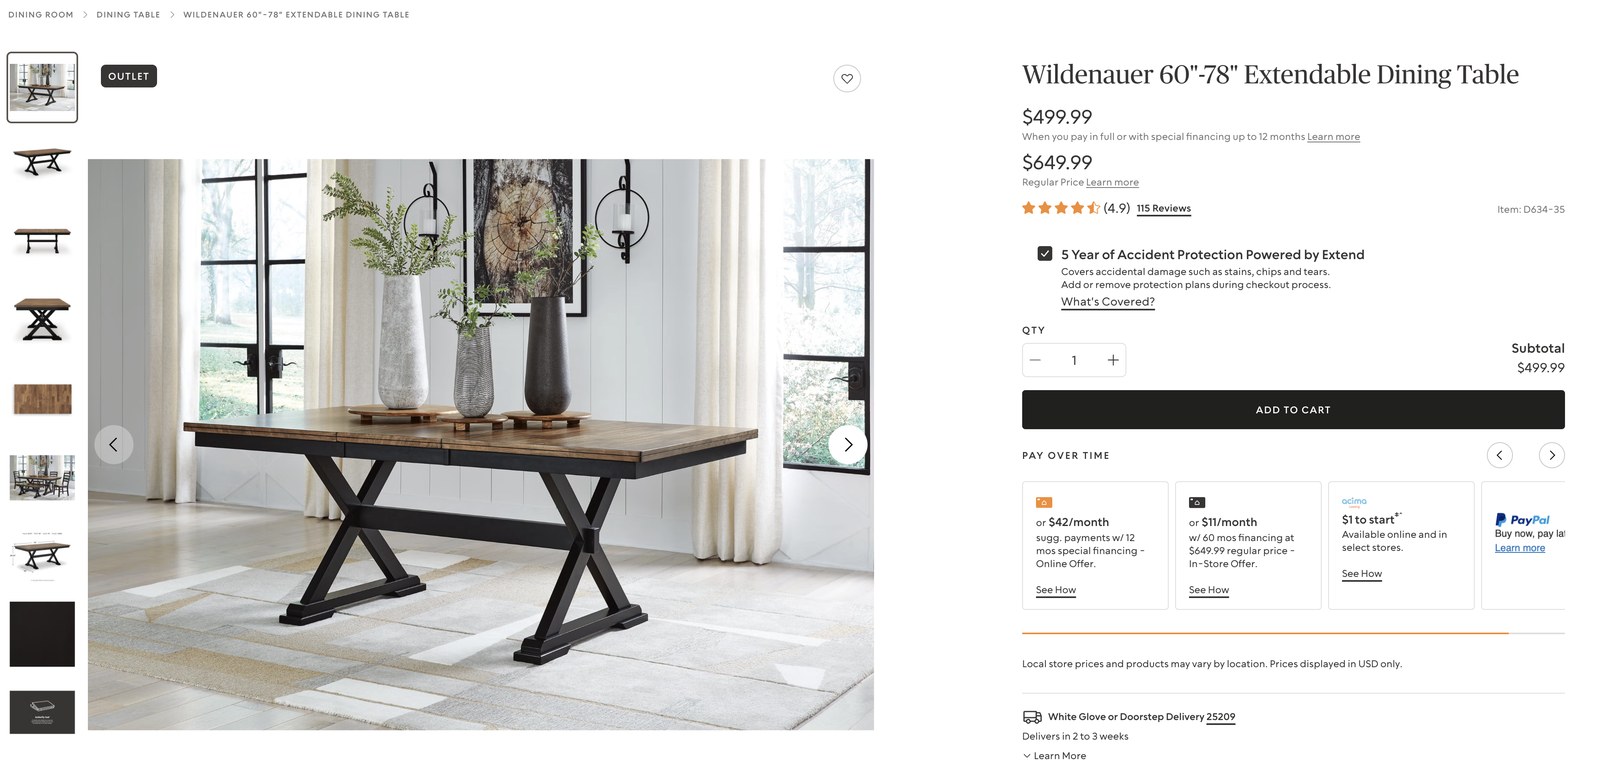
Redesigned product detail page on desktop showing the Wildenauer dining table with price, 5-year protection plan, quantity, and add to cart

Product page: protection plan and financing surfaced before checkout, not buried in it.

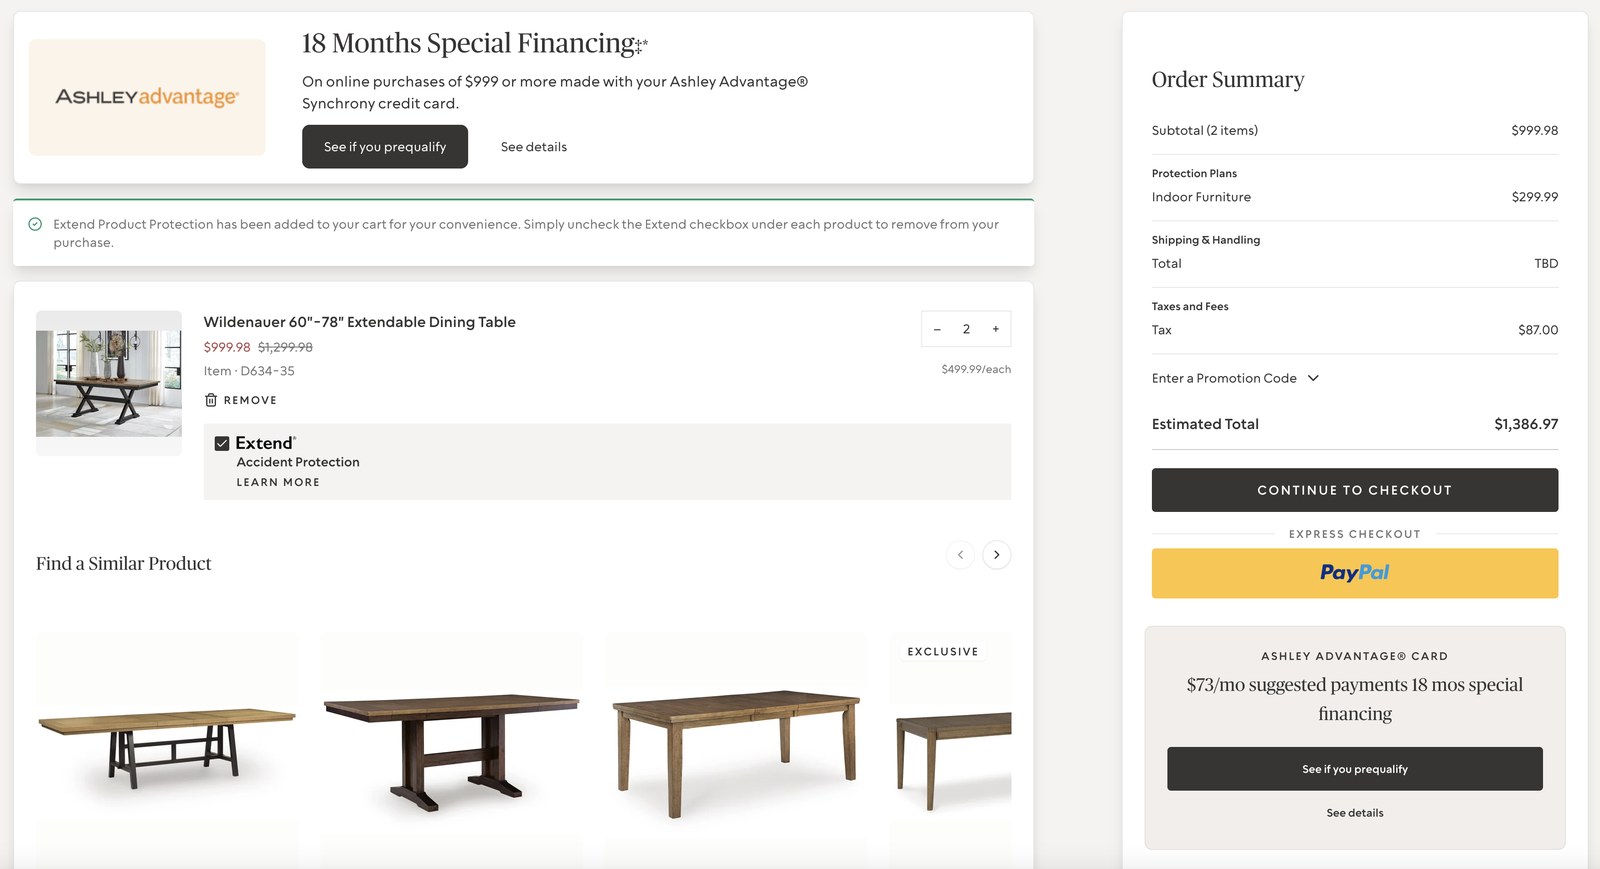
Redesigned cart and checkout page on desktop showing itemized order summary, financing options, and a continue to checkout button

Cart & checkout: an itemized total instead of one ambiguous number.

Mobile: the same flow
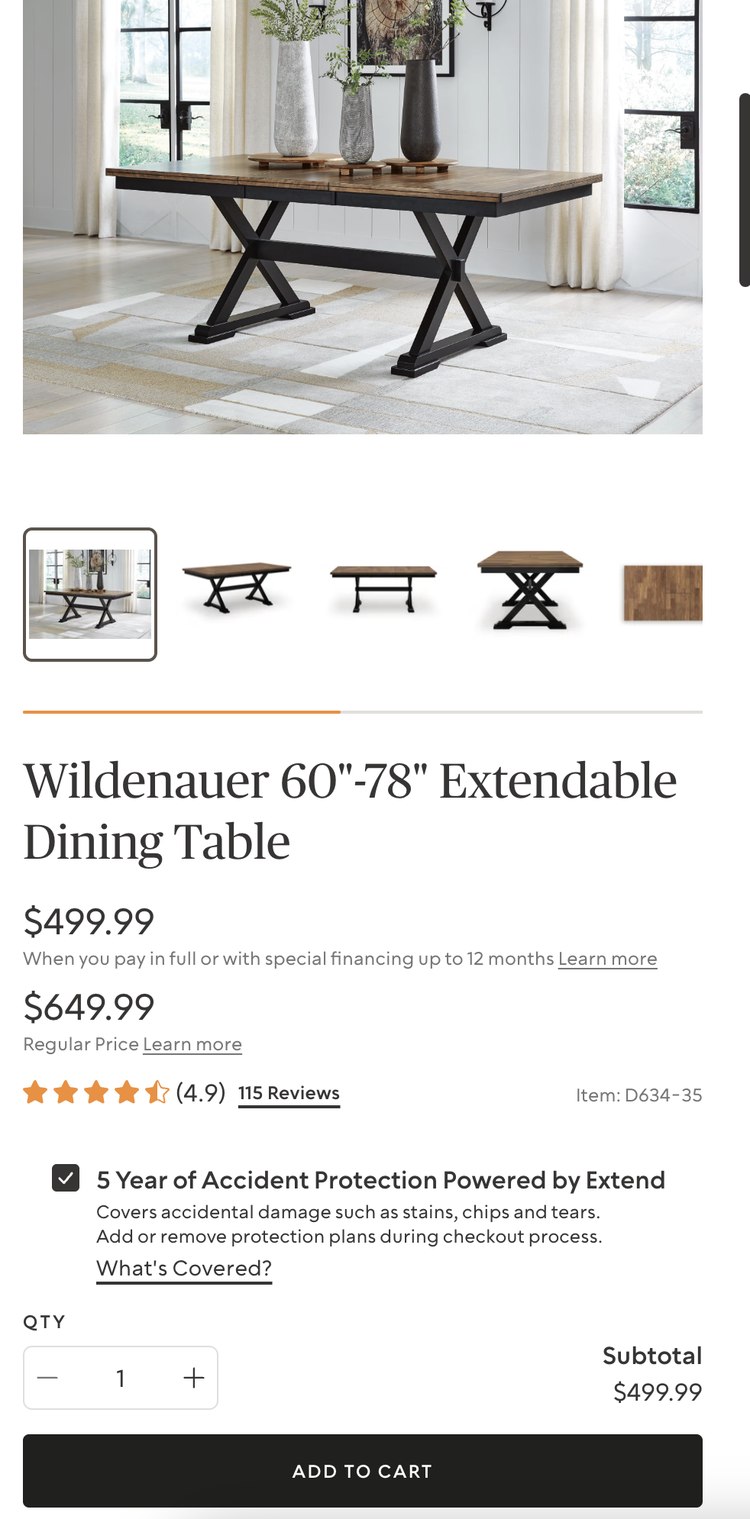
Redesigned product detail page on mobile with the same protection plan and add to cart flow as desktop

Same product page, same trust cues, on mobile.

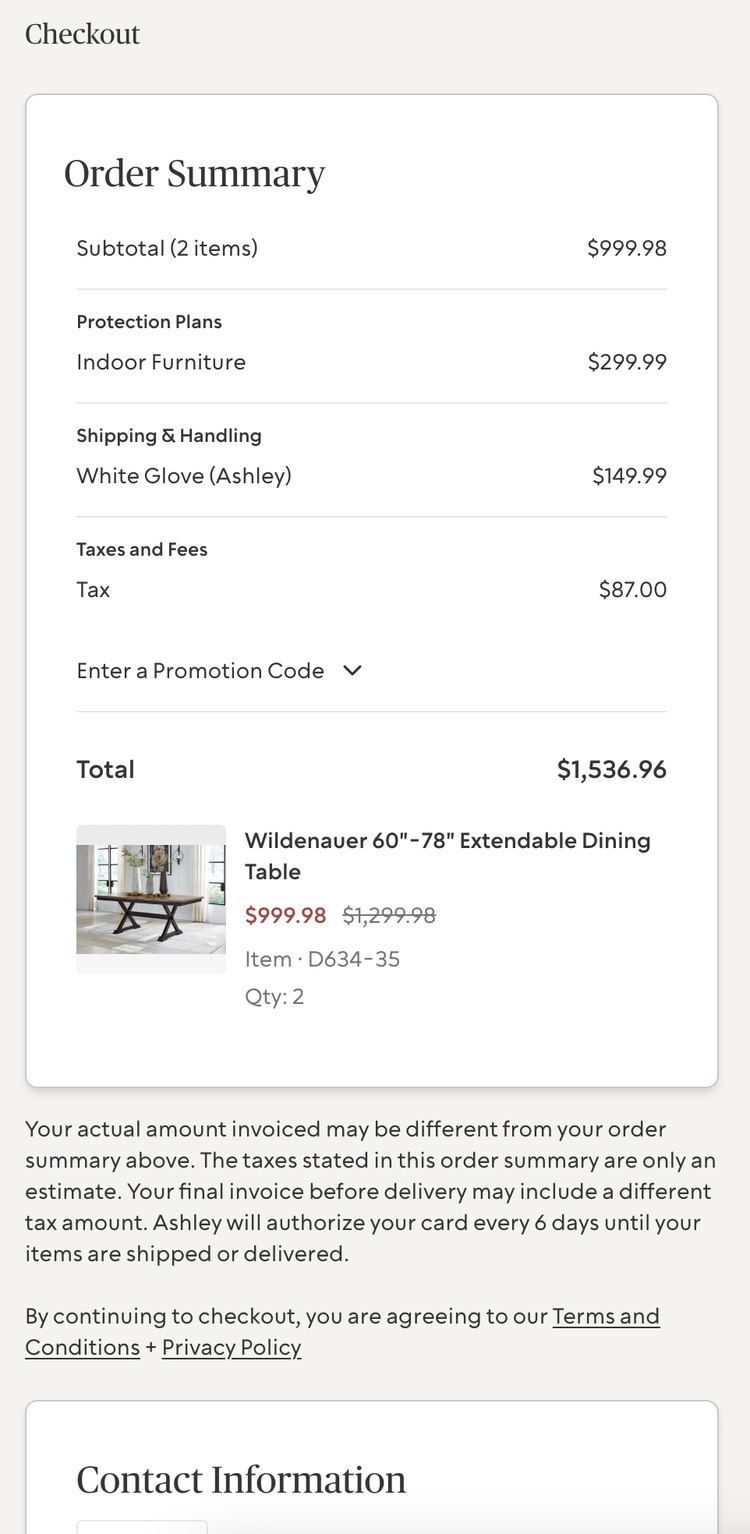
Redesigned checkout page on mobile showing the full itemized order summary, protection plans, shipping, and taxes

The full order summary carried through on mobile, with no collapsed or hidden totals.

18% increase in customer retention.

Simplifying discovery and rebuilding trust into checkout gave shoppers a faster, more confident path to purchase through a catalog they'd found overwhelming, measurable in both usability testing and real sales data after launch.

Measured by comparing website checkout traffic and completion from 2022 to 2023, following the redesigned site's launch.

35%
Reduction in average time-to-purchase
90%
Task completion in final testing, up from 30%
Consistent
Experience held together across web, app, and 2,000+ stores
The warehouse-and-shipping confusion that drove most of the late friction was a research gap, not a design one: I took operations' word that fulfillment was "solved" instead of testing that assumption during discovery, and it cost a round of rework we didn't have slack for. It's the reason I now ask fulfillment questions on day one of a catalog-scale project instead of three-quarters of the way through usability testing.
Next case study
IGT