A Quiet Platforms fulfillment warehouse exterior with the Quiet Platforms logo
Case Study: B2B SaaS Platform · Customer Master, 0 to 1

Building Customer Master, a Single View of Partner Data at Quiet Platforms

15%
Fewer partner-data-related support tickets
10%
Increase in internal team adoption
Estimated from analytics in the 8–10 weeks after the MVP launched, compared against the period before.
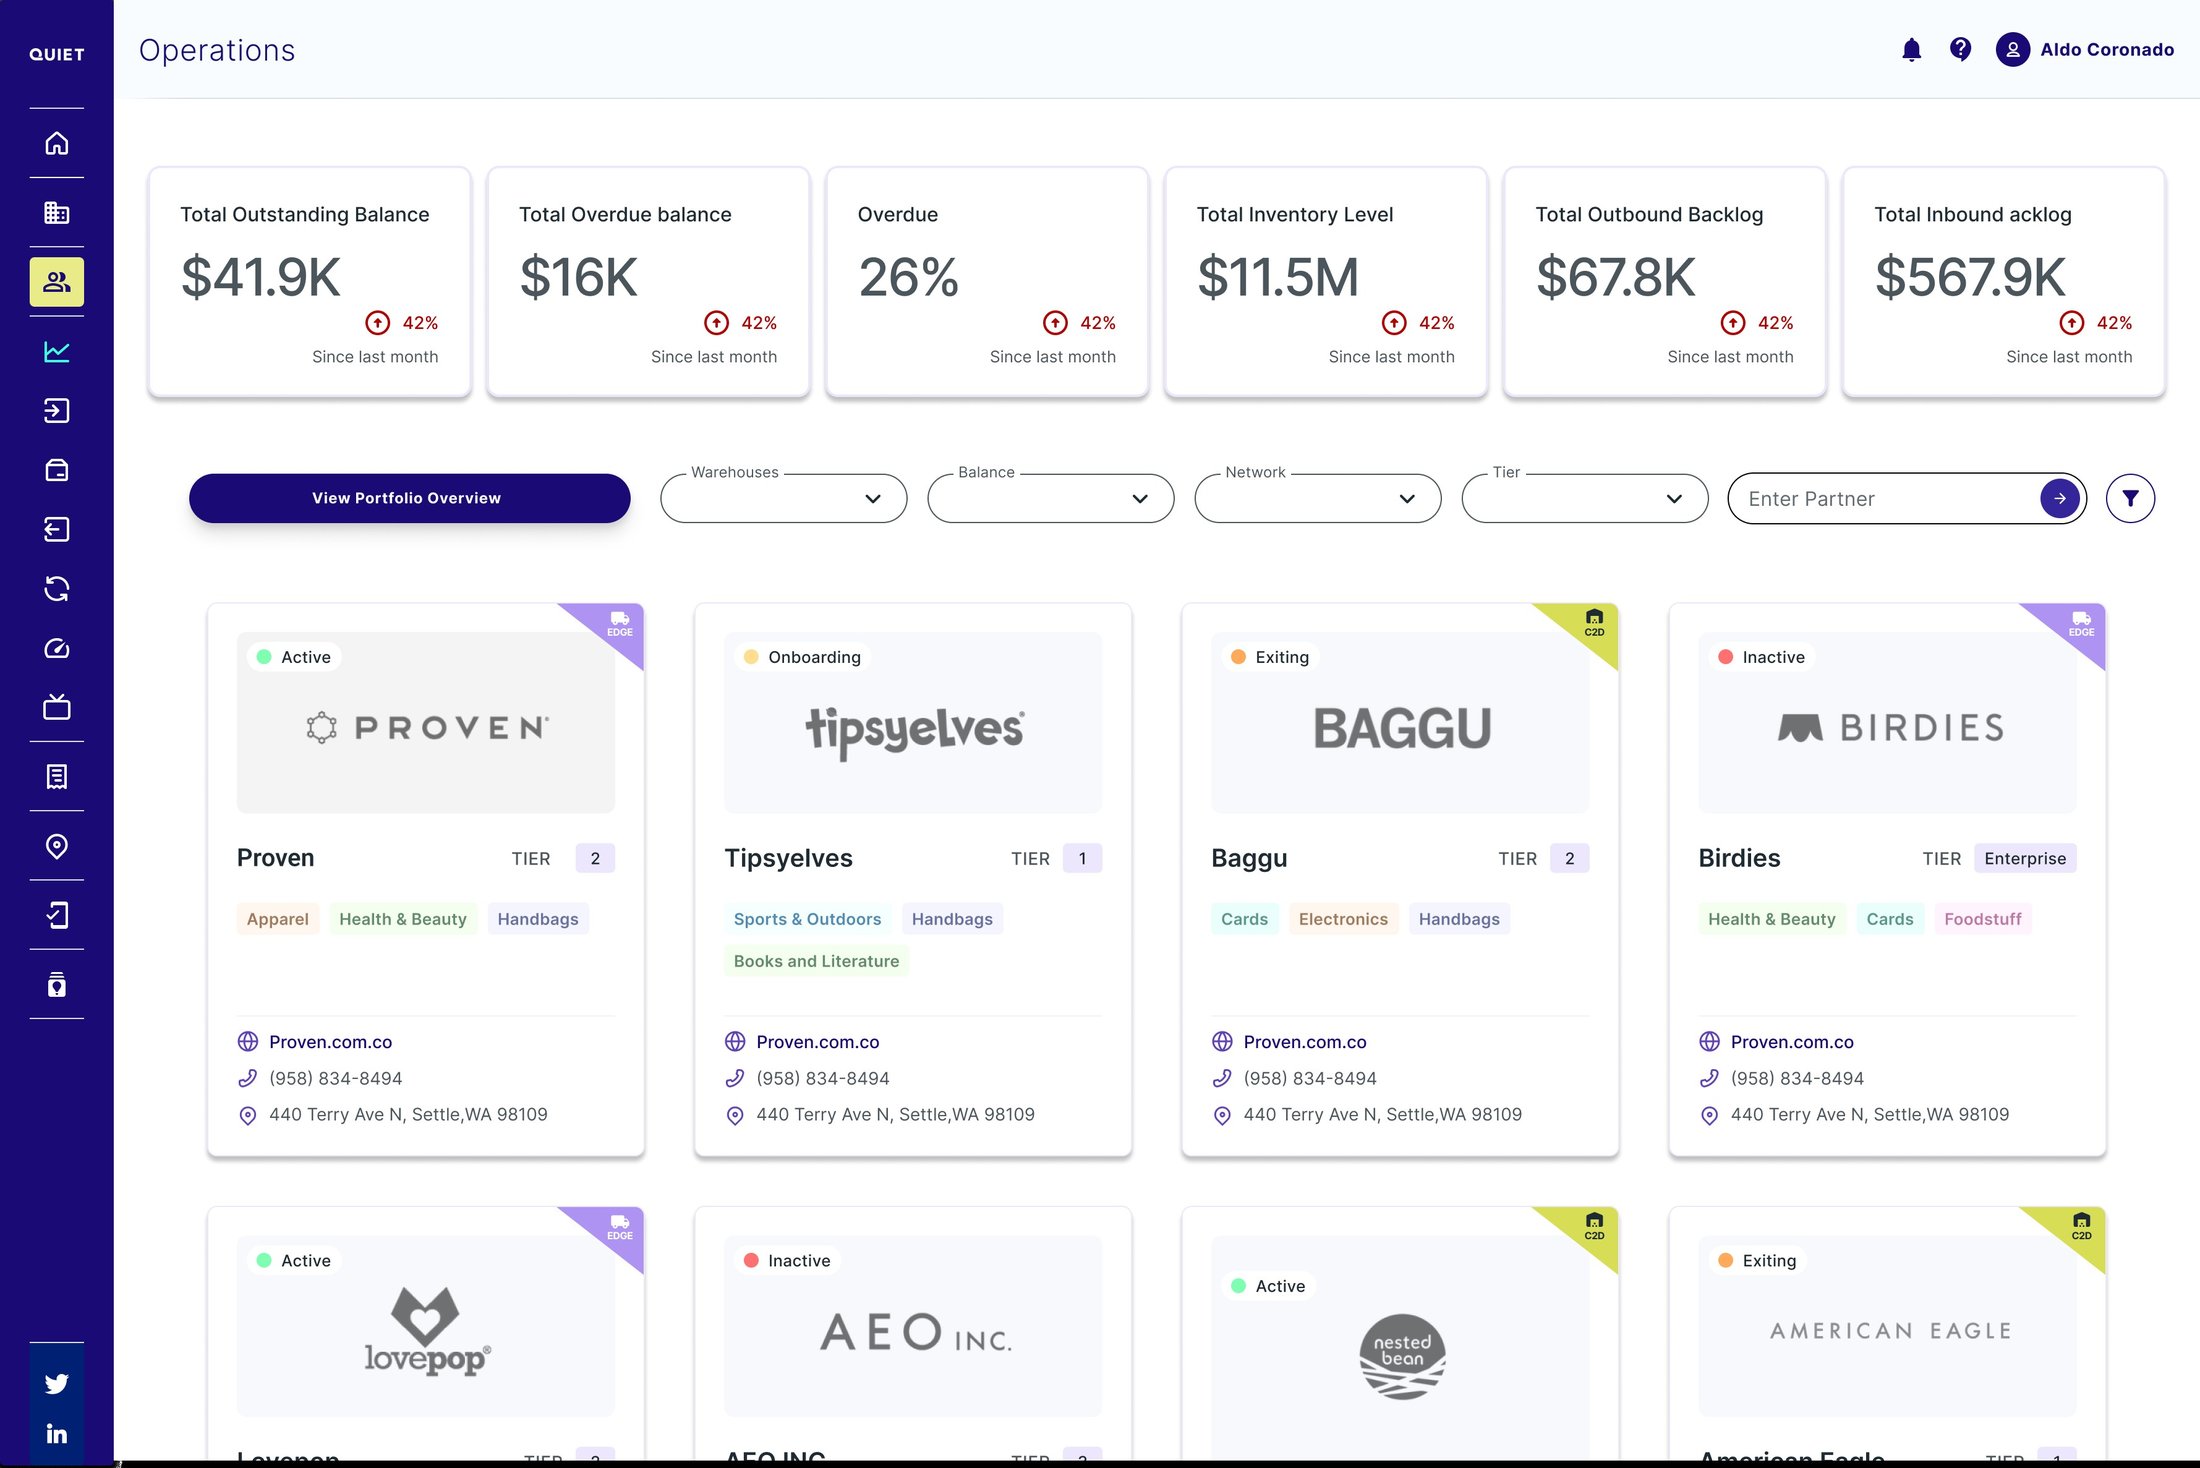
Customer Master Operations home screen listing every partner as a card, with portfolio-wide stats and filters by warehouse, balance, network, and tier

Quiet Platforms is a B2B SaaS platform running logistics and fulfillment for e-commerce and retail brands. Ask a simple question about a partner, and you'd likely get four different answers from four different systems: invoicing, the partner portal, the WMS (warehouse management system), and transportation. Customer Master is the 0-to-1 feature I designed so business, product, customer service, and support could finally see everything about a partner in one place.

There was no existing screen to improve on. Much of what a partner had contracted only existed in the signed contract, not in any system, so starting from zero meant defining what data needed to exist before a single screen could get designed.
RoleSenior User Experience Designer & Product Designer
CompanyInsight Global
ClientQuiet Platforms
Team1 UX/UI designer (me), 2 POs, 2 stakeholders, 1 project manager, 5 developers
DurationOngoing since 2025
My Role

I work as a Senior User Experience Designer & Product Designer at Insight Global, on the Quiet Platforms account. Customer Master didn't exist: this is a 0-to-1 project. I own product strategy, research, information architecture, and interaction design from day one.

I also actively decided what stayed out of the MVP: certain shipping configurations and site IDs got deferred so they wouldn't block the first release.

Focus: 0 to 1 Internal Platform · Tools: Figma, FigJam, AI-assisted prototyping · Accessibility: Contrast for visual impairments, full keyboard navigation, focus indicators

Quiet Platforms had no single record of who its partners were

"Customer master data" is supposed to be a company's single, authoritative record of a customer, one every other system defers to. Quiet Platforms didn't have one: each partner's information lived scattered across invoicing, the partner portal, the WMS, and transportation, and sometimes only in the signed contract. Nobody could confidently answer a simple question about a partner without hunting for it.

Before Customer Master Invoicing Balance owed Partner Portal Paid in full WMS No record Transportation Balance disputed After Customer Master Invoicing Portal WMS Transport Customer Master One balance, one answer
Before, the same question about a partner's balance got a different answer from each system. After, all four feed the same Customer Master record, which answers once.

For the operations team

Updating a partner's information had no clear owner or process, so changes often didn't reach every team that needed them.

For QP's partners

Basic account questions took longer than they should have to resolve, because whoever answered was reading from whatever system they had access to, not a shared record, or had to go reread the contract.

Showing the path with real examples

Not everyone was sold on building a full Customer Master. Instead of arguing for it in the abstract, I ran a working session with the team and showed how companies like Henkel already treat a single customer record as standard, not a luxury: a dedicated role, a data-governance program, or a platform built for it. Seeing what QP stood to gain by doing the same is what got the project greenlit.

Henkel

Manages global consumer and industrial data through a dedicated role: Customer Master Data Specialists, people whose job is explicitly to own and maintain this information.

Littelfuse

Runs a formal "Customer Master Data & Governance" program to keep data streams clean, governance as a process, not just a role.

Large Enterprise & Retail Brands

Companies like Amazon, Walmart, and multinational manufacturers rely heavily on master-data platforms (such as Informatica, SAP, or Boomi DataHub) to maintain unified customer records.

Quiet Platforms had none of the three: no dedicated role, no governance program, no platform. Which is exactly why Customer Master needed to be built as its own product surface, not a report bolted onto another tool.

Figuring out what data existed, before organizing it

Before I could design a single screen, I needed to know what partner information existed, where it lived, and who needed it, so I ran sessions with business, product, invoicing, and support.

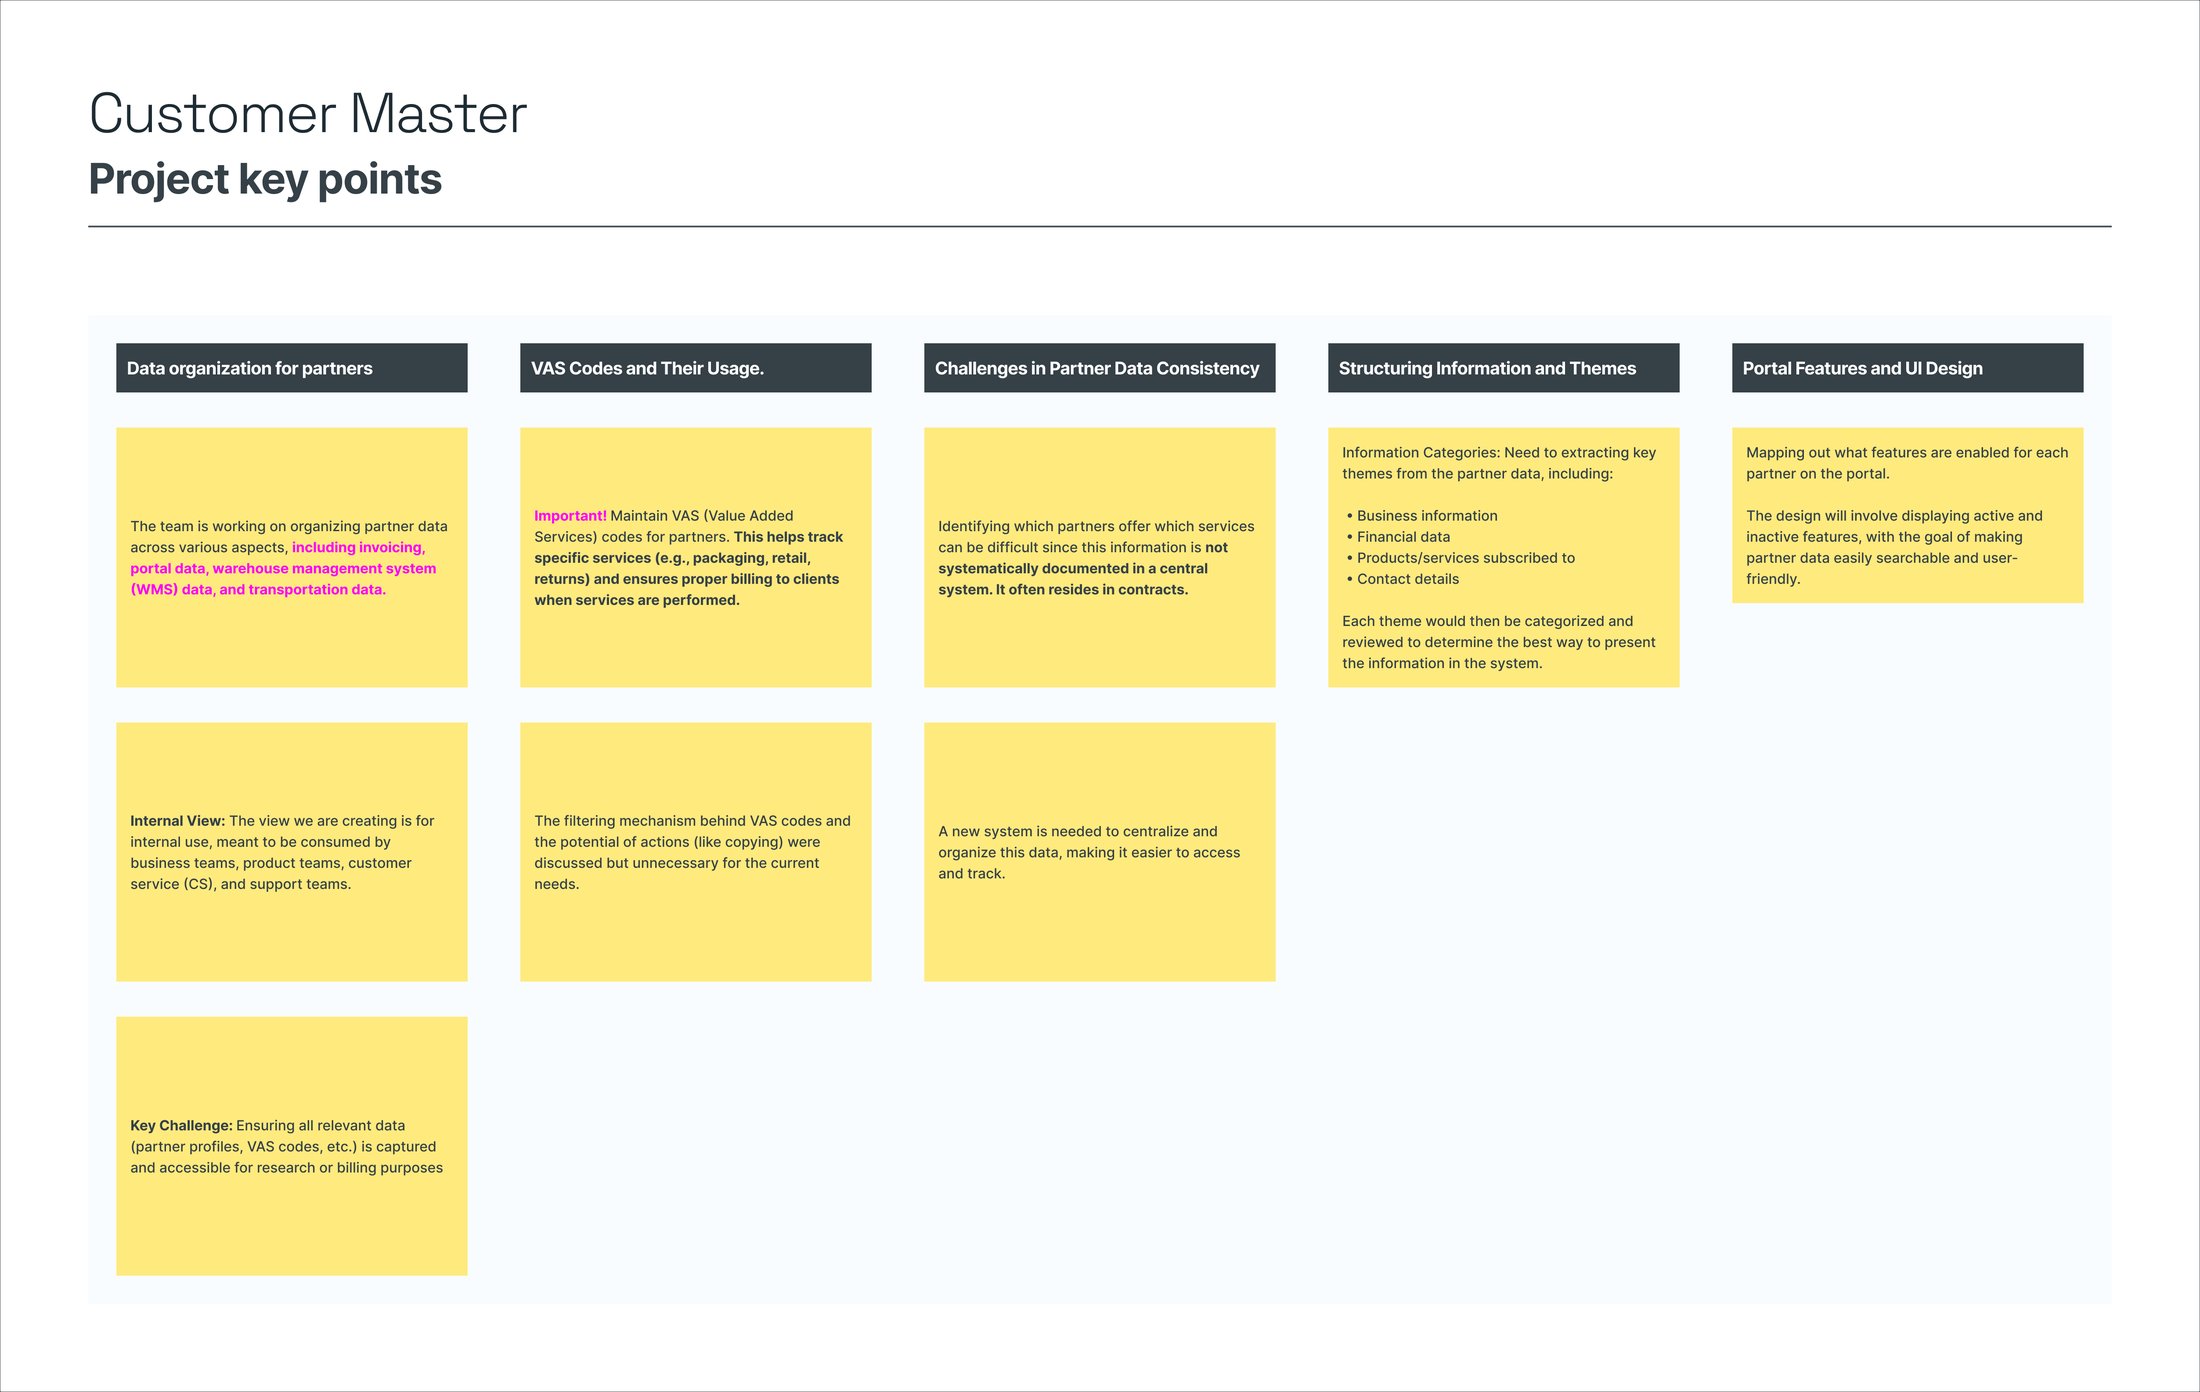
Research synthesis board covering partner data organization, VAS codes, challenges in data consistency, information themes, and portal feature mapping

Synthesis from the discovery sessions: how partner data is organized today, and where information only lived in contracts.

Key finding

Which services a partner offered was hard to track: it often only lived in the signed contract, not any system.

Who this was designed for

An internal view for business, product, customer service, and support, each needing a different slice of the same partner information.

Defining what a "Partner" even is, from scratch

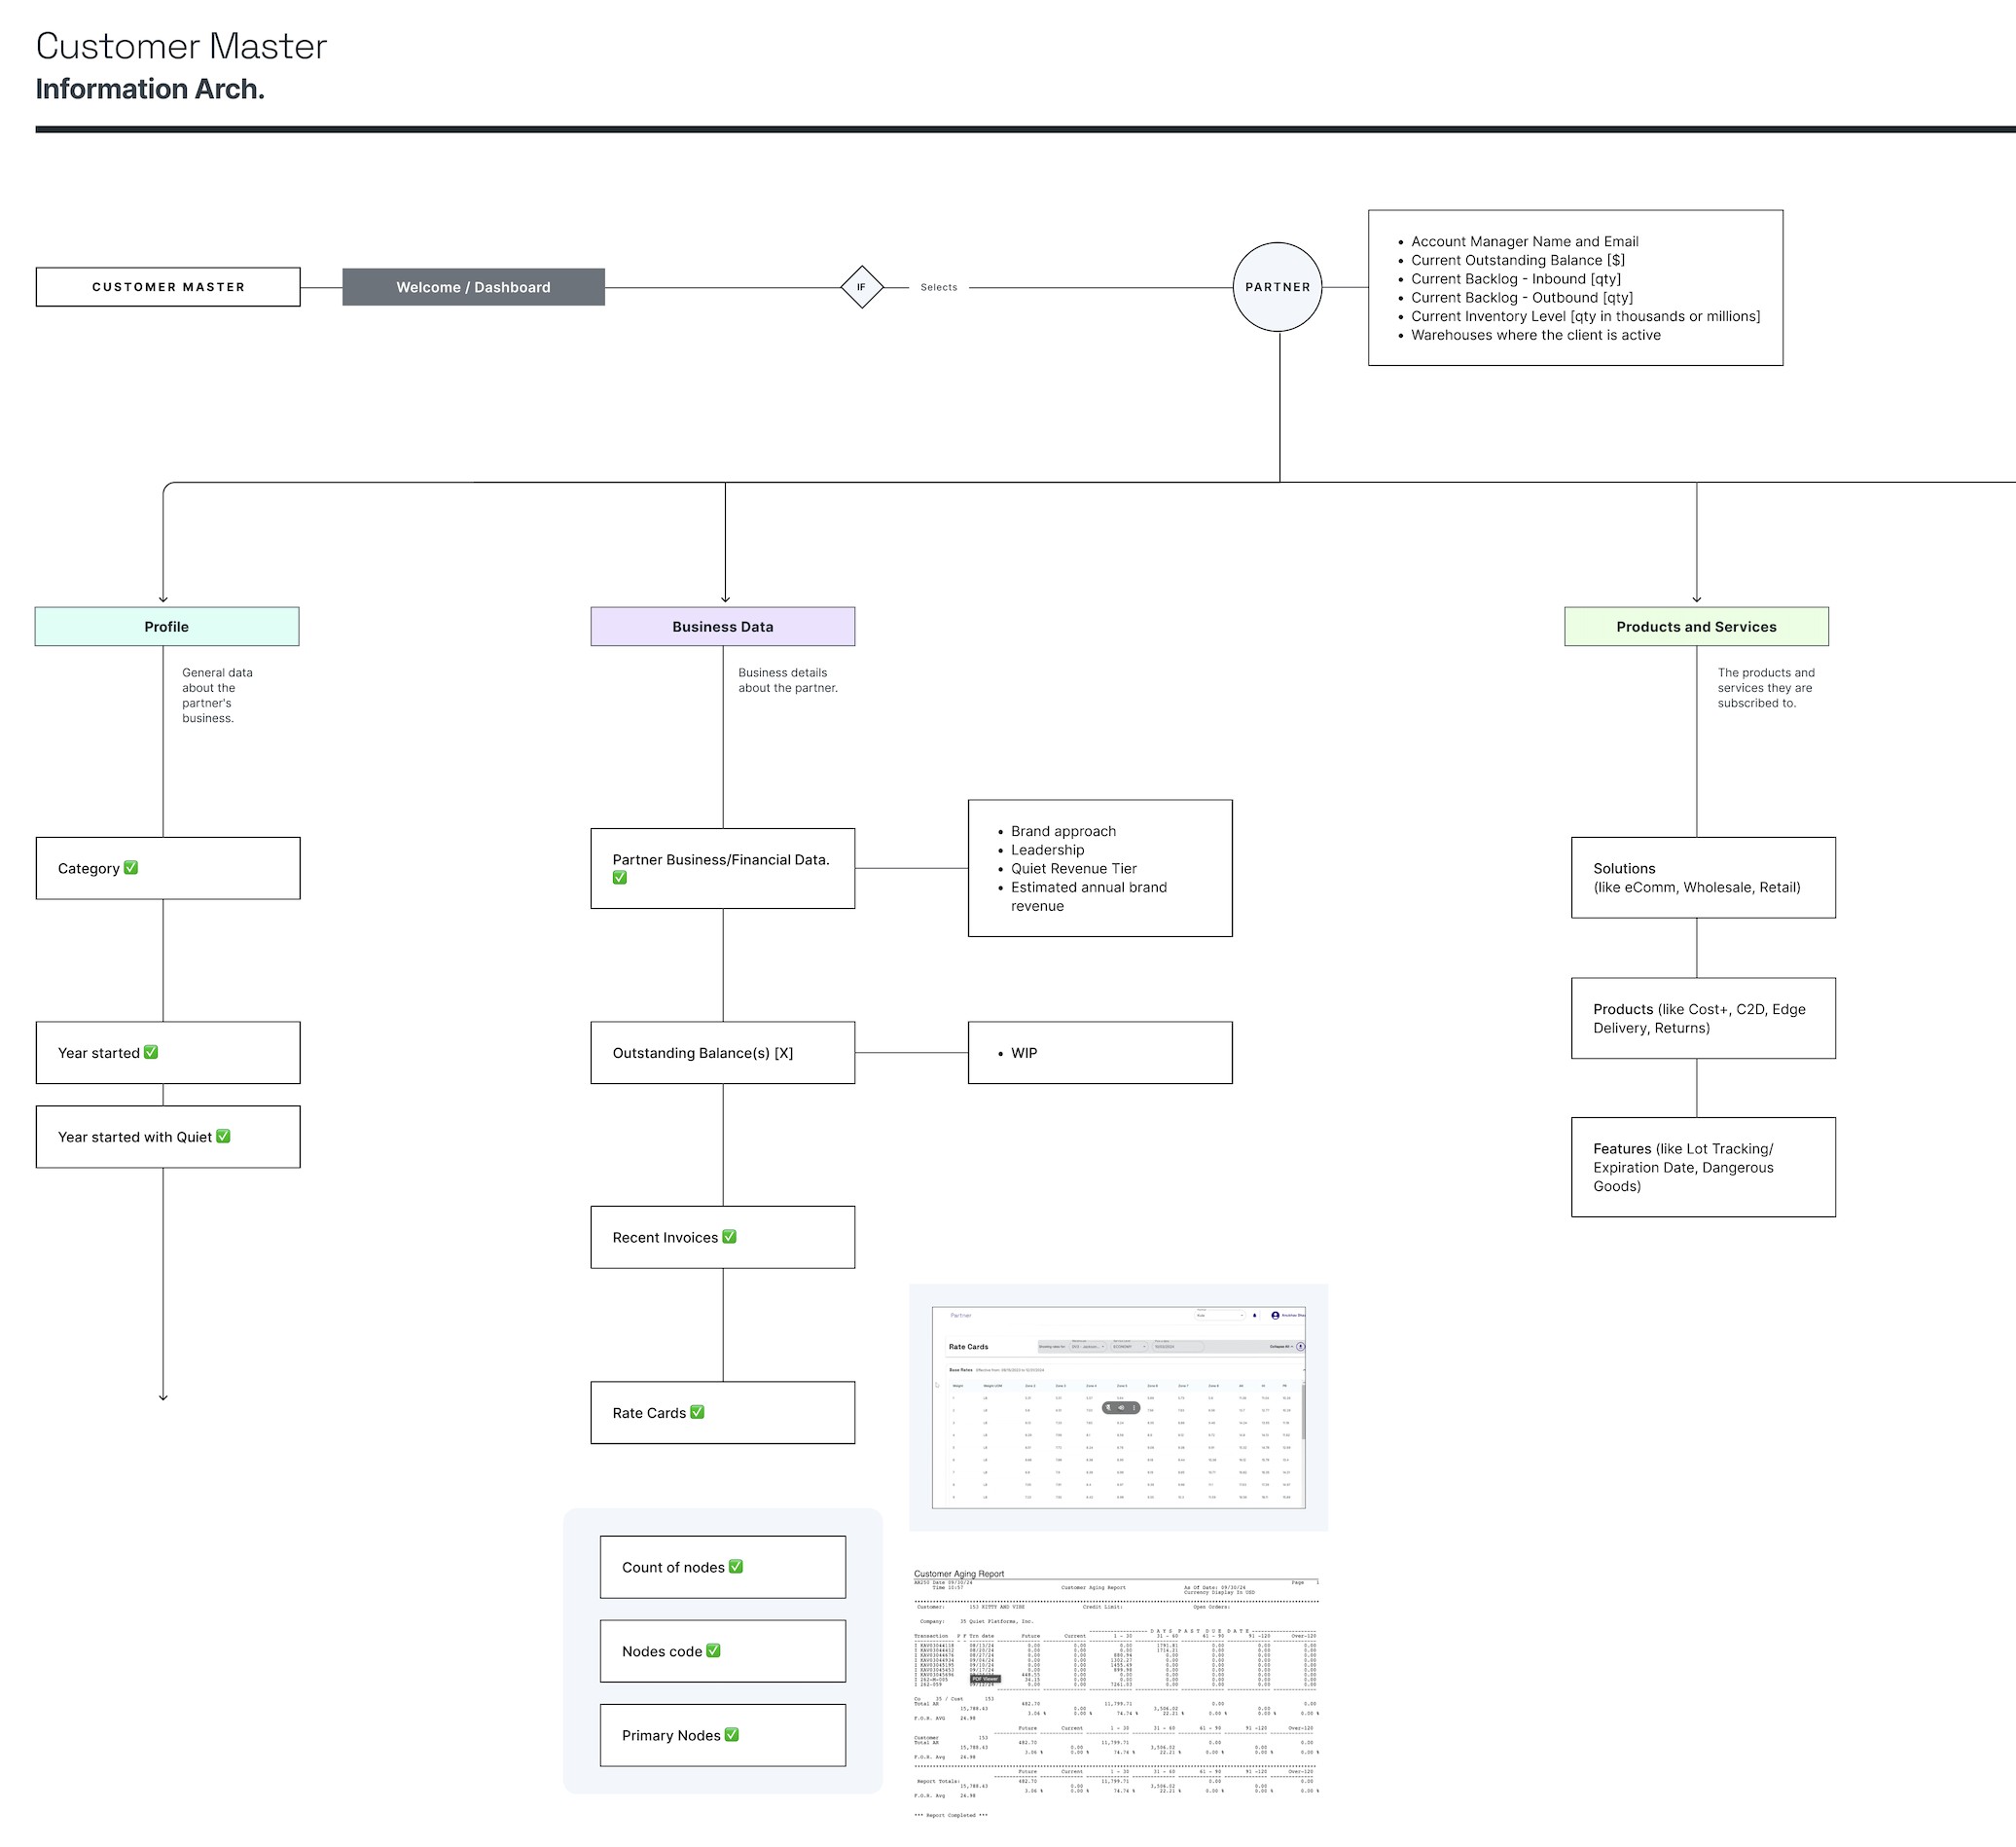
With no existing system to build from, I started with a single central Partner record: the fields any team would need at a glance, like outstanding balance, backlog, and inventory level. Everything else branches out from there.

I grouped the scattered data into six branches, each defined field by field from the discovery sessions.

  • Profile: partner category, year started, and whether they started with Quiet.
  • Business Data: brand approach, revenue, outstanding balance, recent invoices, and the partner's warehouses.
  • Products & Services: which solutions they've subscribed to, which products they use, and which features are enabled.
  • Tech Configurations: portal permissions, and which integrator, OMS (order management system), and e-commerce platform each partner runs on.
  • Shipping Configurations: carrier-specific logic, the branch that depended most on being defined live with operations, with no existing standard.
  • WMS Configurations: package types by channel, each with its own process, plus VAS (value-added services) codes and warehouse configuration.
Some configurations, like certain site IDs, got explicitly marked out of scope for the MVP. Deciding what stayed out was as much the work as deciding what got in.
Full Customer Master information architecture map showing Welcome/Dashboard branching to Partner, then into Profile, Business Data, and Products and Services

The full map: from the Partner record to the six branches, field by field.

Beyond viewing data: what operations needed to actually do

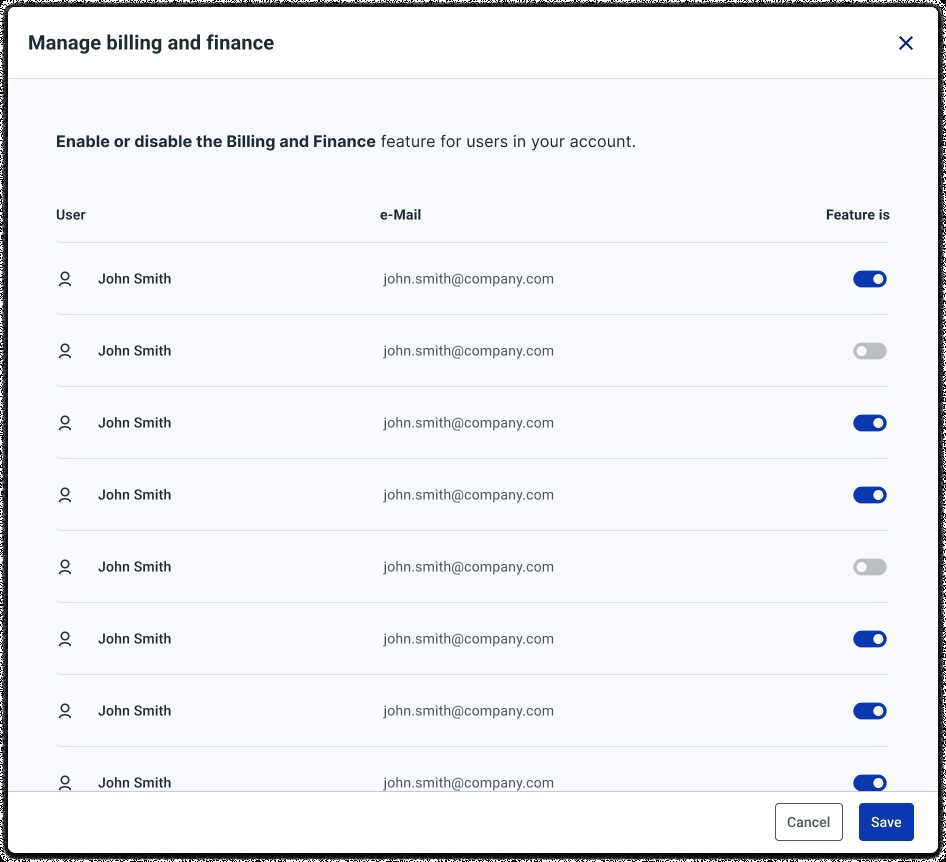
Operations needed more than a read-only view. Anyone with access could edit a partner's status, product categories, or contact details directly, instead of asking someone else to change it in whatever system owned that field. Each feature toggle came with its own follow-up decision: enabling Billing & Finance surfaced the partner's full user list to choose who got access, and Scheduled Reports worked the same way, per report.

Manage Billing and Finance modal with a per-user toggle list to control which users can see the feature

Per-user control: who can see Billing & Finance.

AI-Assisted

I used Figma Make and Claude to compare two portfolio-view concepts in parallel instead of over a full sprint. The version rebuilt with real filters is the one that won.

From low-fidelity skeletons to metrics that actually mattered

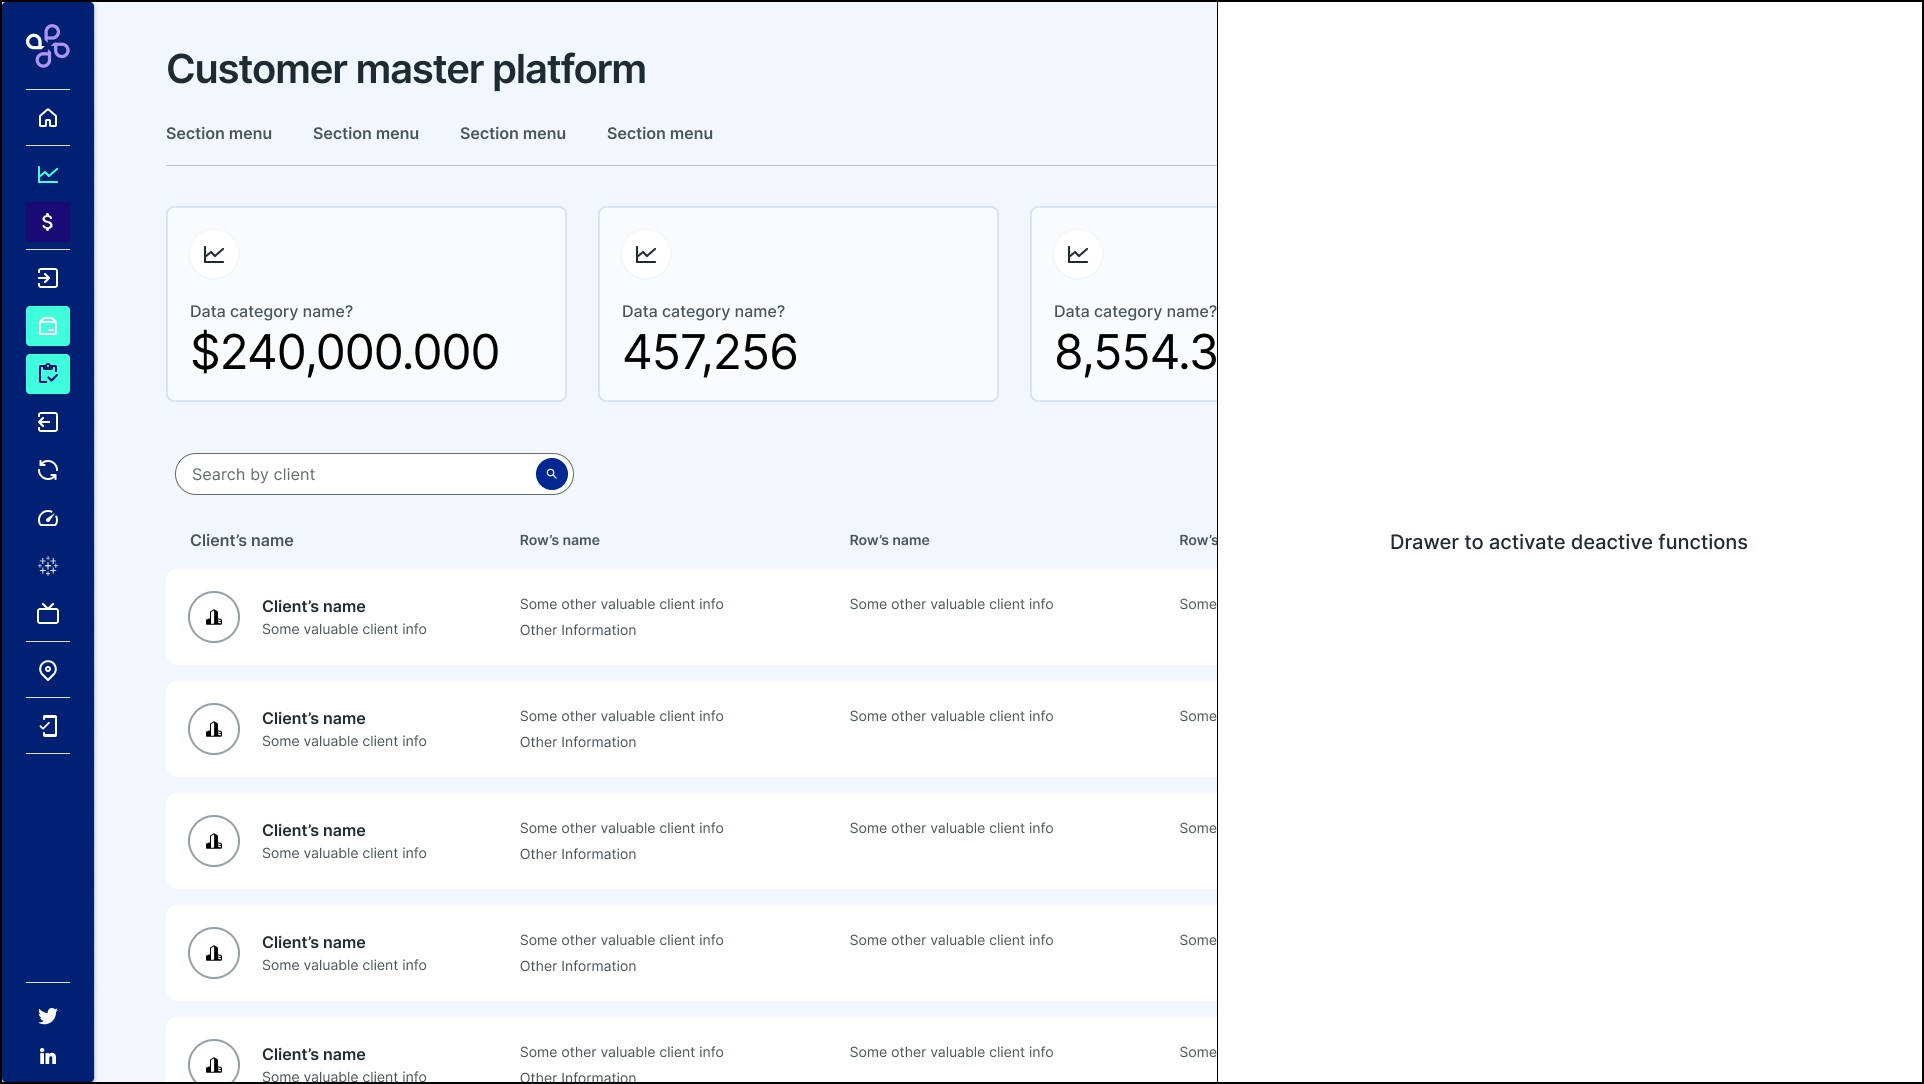
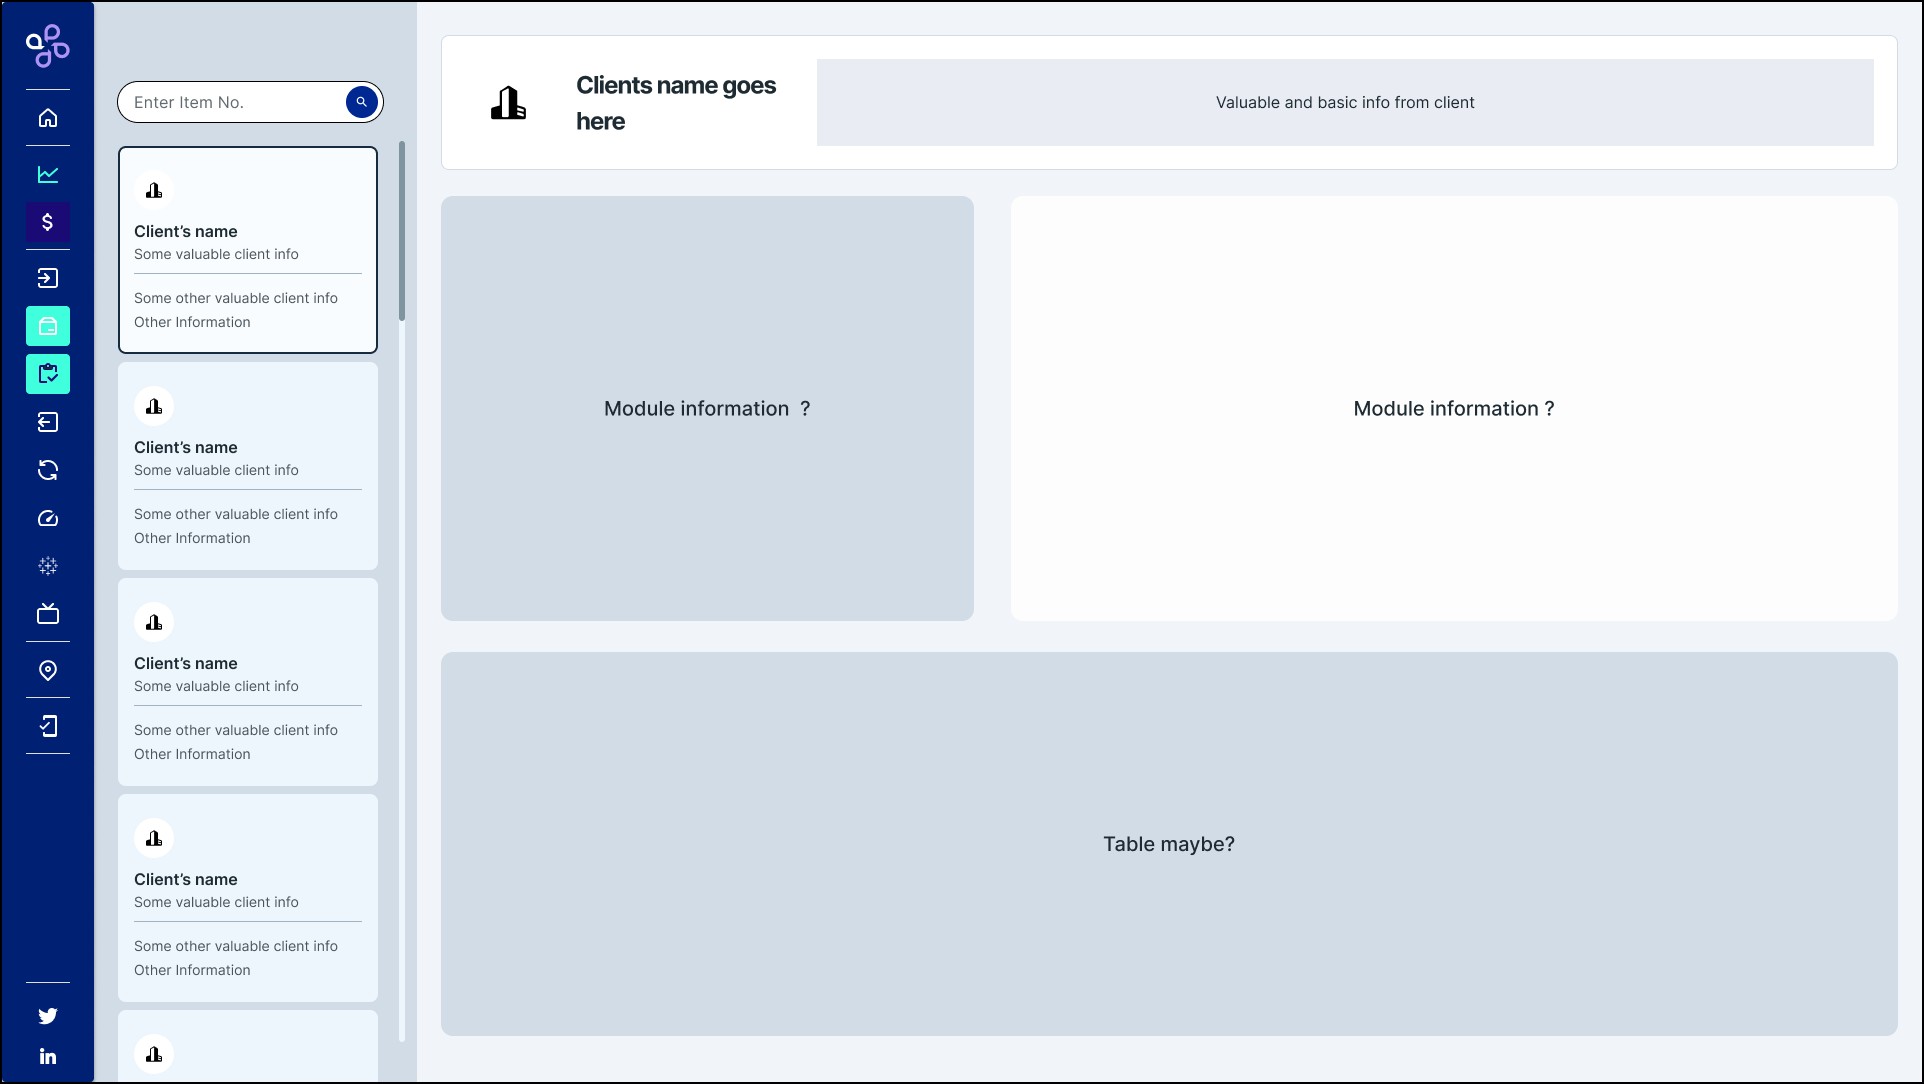
Before any high fidelity, I explored structure with empty boxes and literal placeholder questions, "module information?", to agree on layout before investing time in real content.

Low-fidelity wireframe of the landing screen with placeholder stat cards, a client search bar, a client table, and a drawer labeled 'Drawer to activate deactive functions'

Skeleton of the landing screen: cards, a client table, and a drawer to activate functions.

Low-fidelity wireframe of the individual partner overview with placeholder boxes labeled 'Module information?' and 'Table maybe?'

Skeleton of a single partner's overview, before deciding what went in each box.

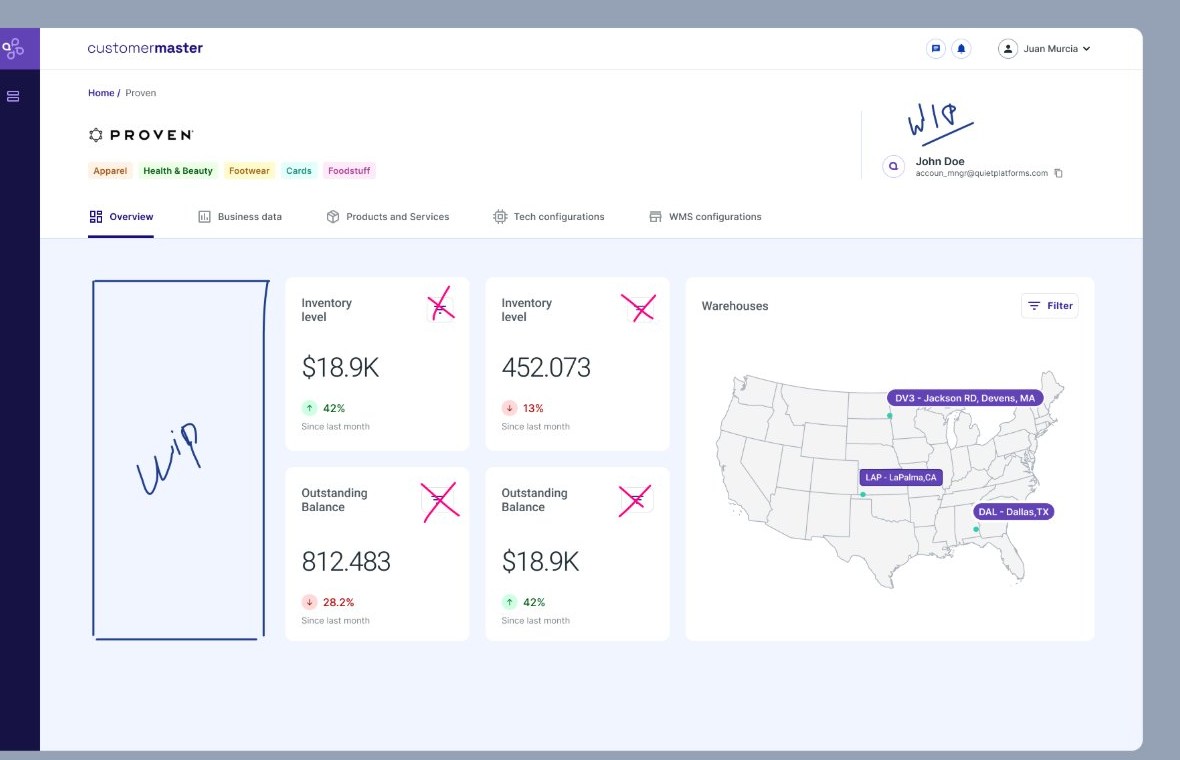
Early exploration of the partner overview panel with duplicate metric cards crossed out and a handwritten WIP note

One step closer: crossing out which metric cards were redundant.

This wasn't formal usability testing, it was two real checkpoints with the people who'd use it

No lab study. Validation happened through workshops with the product team during discovery, plus demo sessions where ops, customer service, and finance reacted to what was actually being built. One of those reactions changed the design.

Direction, signed off before going further

The Exploration skeletons went in front of ops, customer service, and finance to confirm the layout before any screen moved to high fidelity. That sign-off is what the rest got built on.

The map lost the argument

I had put the map front and center in the first overview, with metrics secondary. In the demo, that didn't land: stakeholders wanted the numbers up top, with the map supporting them. I took that pushback and rebuilt the overview around the metrics, which is how it looks below.

The first thing shipped was just the central Partner record

The full Customer Master was too much for a first release, so the MVP was scoped down to a single screen: the overview, with balance, inventory, and a live map of the partner's warehouses. Everything else got built after.

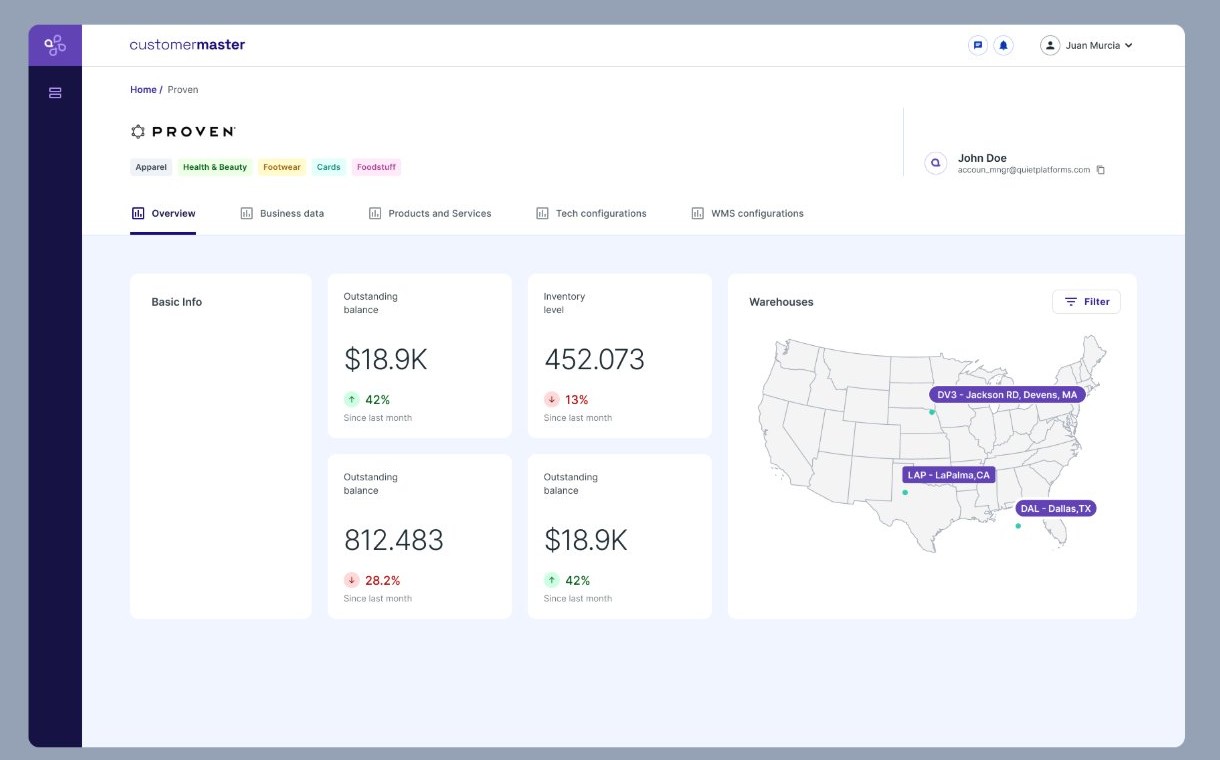
Customer Master partner overview showing basic info, outstanding balance, inventory level, and account manager contact

Partner overview: basic info, outstanding balance, and inventory level in a single screen.

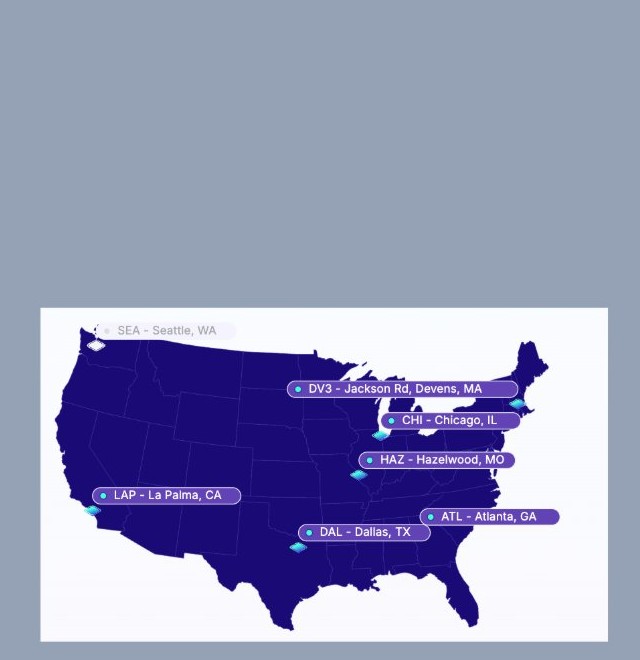
Warehouse visibility map showing active facility locations for a partner across the United States

Warehouse visibility: which facilities a partner is active in, at a glance.

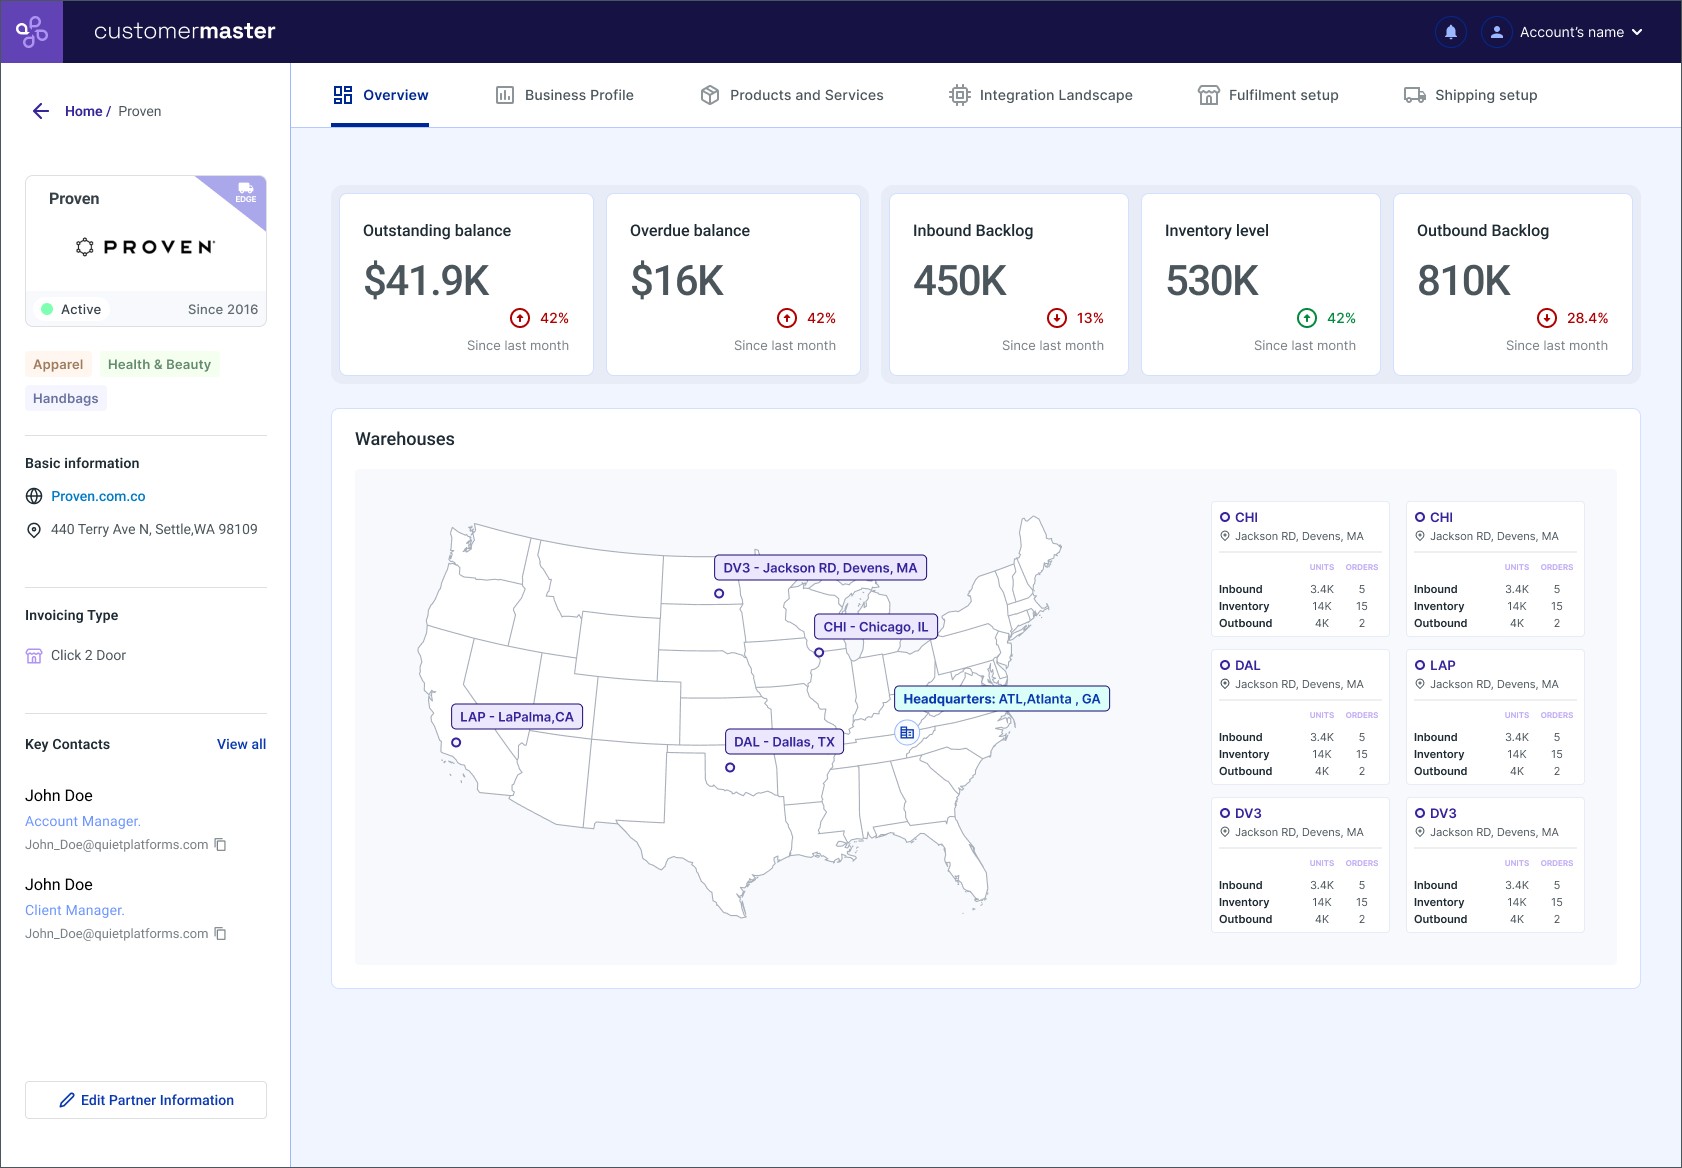
That first version is what got demoed, and the map-first layout didn't land. The next iteration merged both panels, moved the metrics to the top, and pushed warehouse-level detail into the map itself.

Updated partner overview with five stat cards and a warehouse map showing per-warehouse inbound units and orders, inventory, and outbound units and orders

The final version: metrics up top, and the map carrying inbound, inventory, and outbound per warehouse.

View interactive prototype in Figma →

Once the MVP was validated, the rest of Customer Master got built behind tabs

The overview answers "how is this partner doing right now?" The five remaining branches got built afterward as separate tabs, each for a different team: finance needs Business Profile, operations needs Products and Services, tech needs Integration Landscape, the warehouse needs Fulfilment setup.

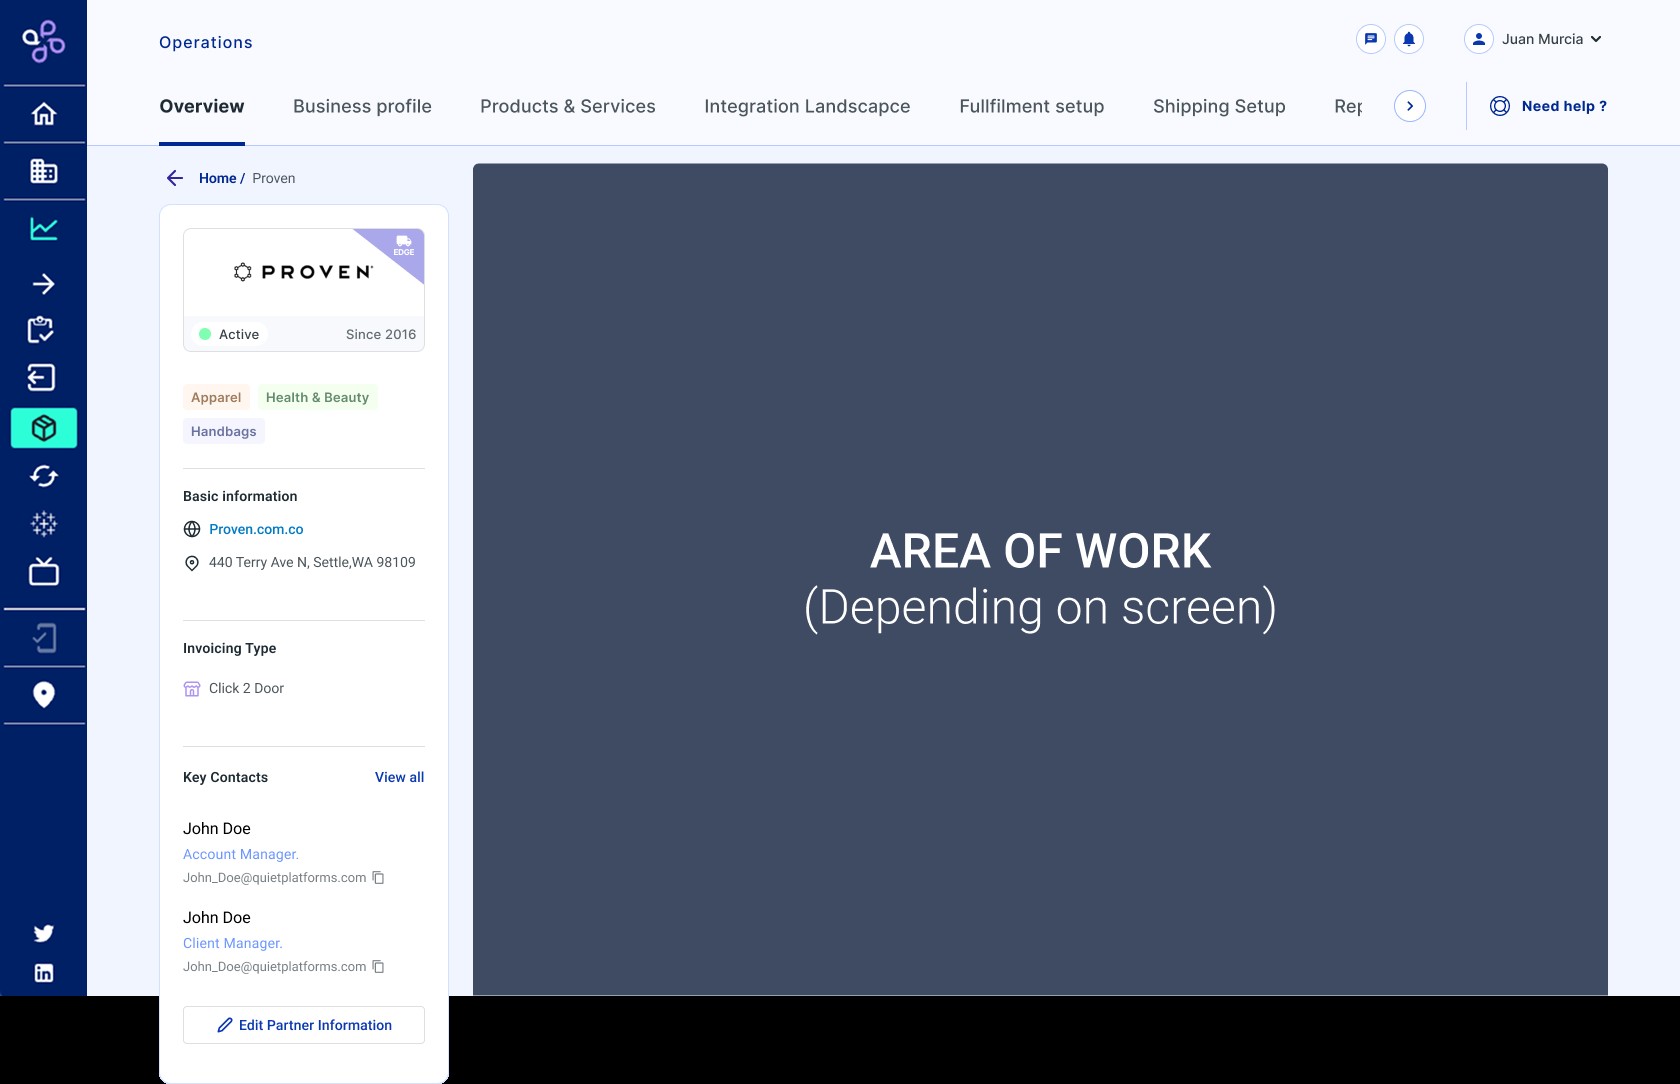
Wireframe of the Customer Master tab structure: Overview, Business Profile, Products and Services, Integration Landscape, Fulfilment setup, Shipping Setup, and Reports

The tab structure, defined before any of them had real content.

  • Business Profile: Revenue Data (revenue by period and projections) and Invoicing & Rates (every invoice and the historical outstanding/overdue balance).
  • Products and Services: which solutions, products, and features a partner has, plus the VAS matrix by warehouse and direction.
  • Integration Landscape: portal permissions and the list of third-party integrators a partner runs on, without asking the tech team.
  • Fulfilment Setup: package types by warehouse, whether they're branded, and current stock, the same information that used to live only in a separate spreadsheet.

Once the data existed, it became the foundation for everything else

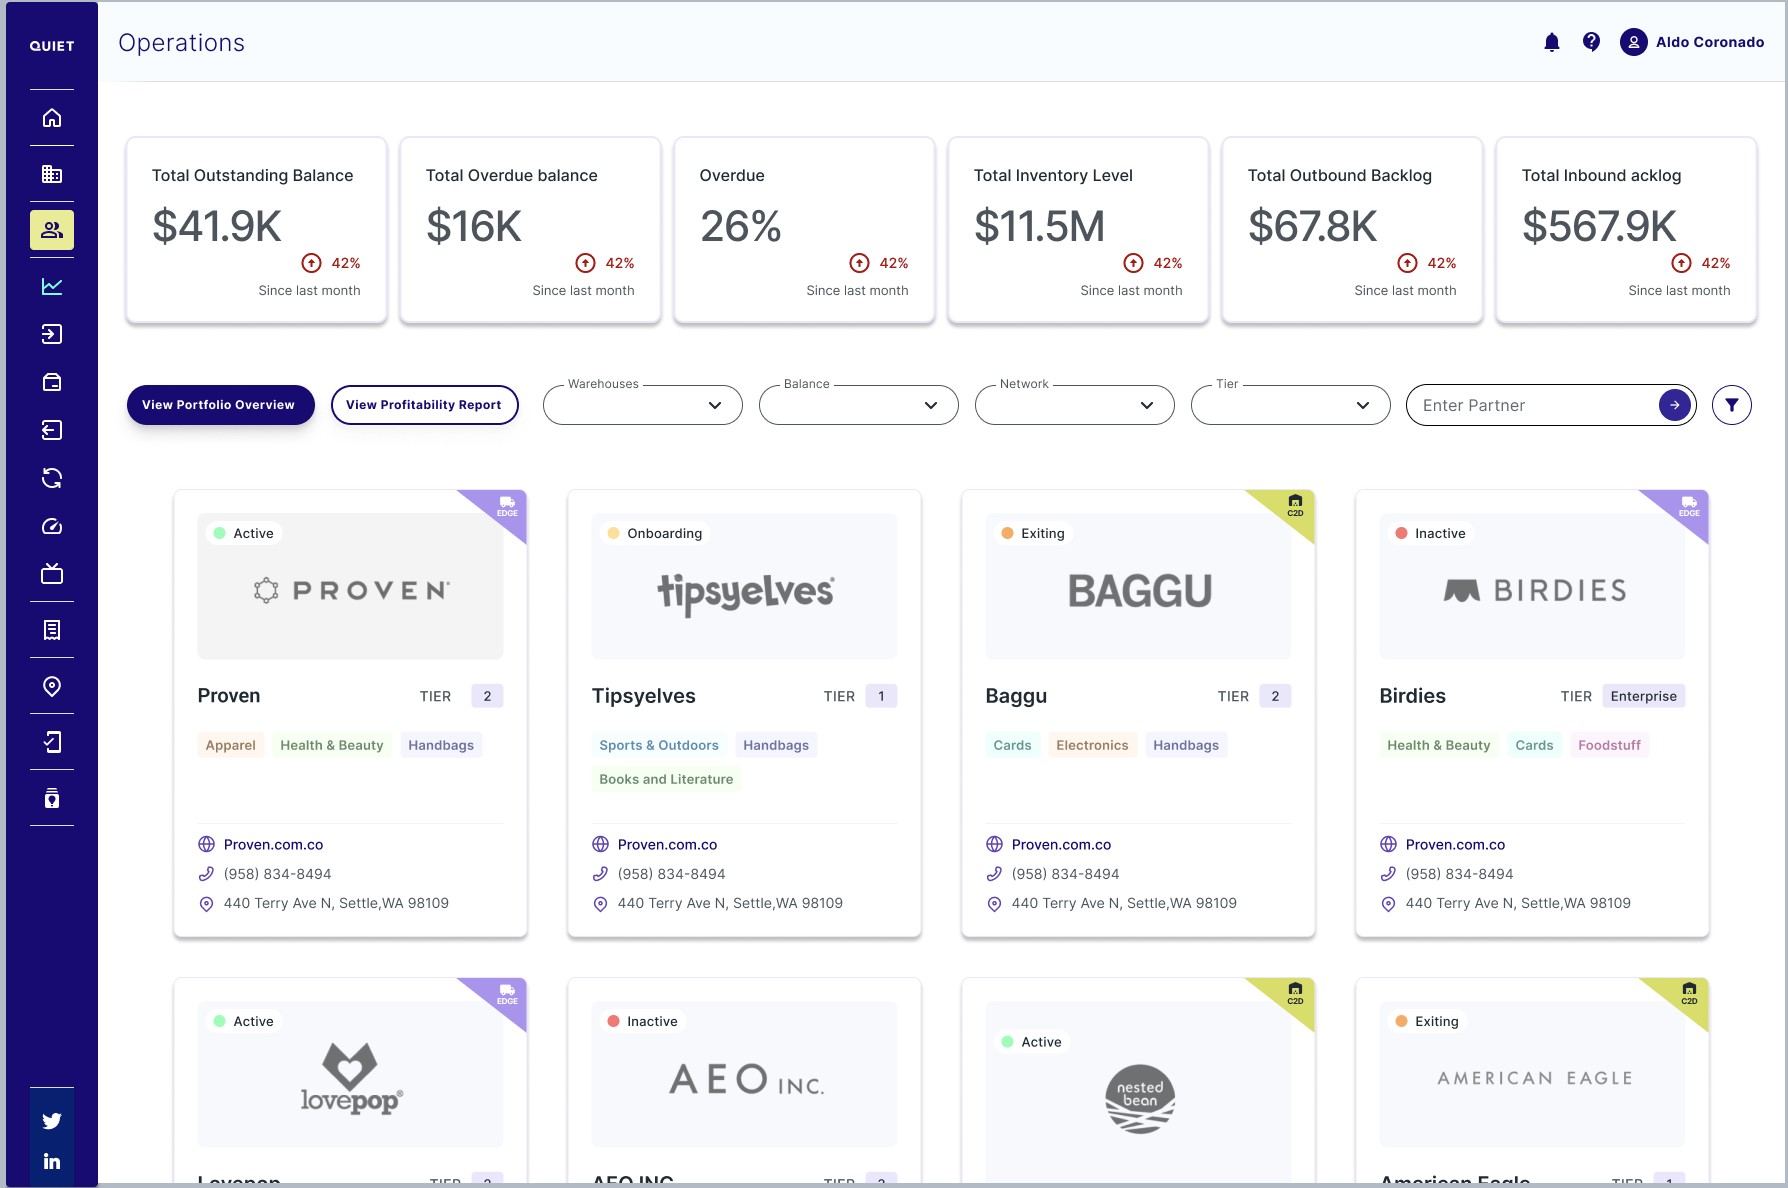
Customer Master didn't stay a single-partner screen. It grew into the operations directory, with the same core metrics rolled up across the portfolio at the top. From there, "View Portfolio Overview" aggregates that same data across every partner, only possible because each one already lived in the same shape.

Operations directory screen listing all Quiet Platforms partners with portfolio-wide balance, inventory, and backlog metrics at top, and a View Portfolio Overview button

The partner directory: portfolio-wide metrics up top, and direct access into the Portfolio Overview.

Portfolio Overview: the final stage of the release

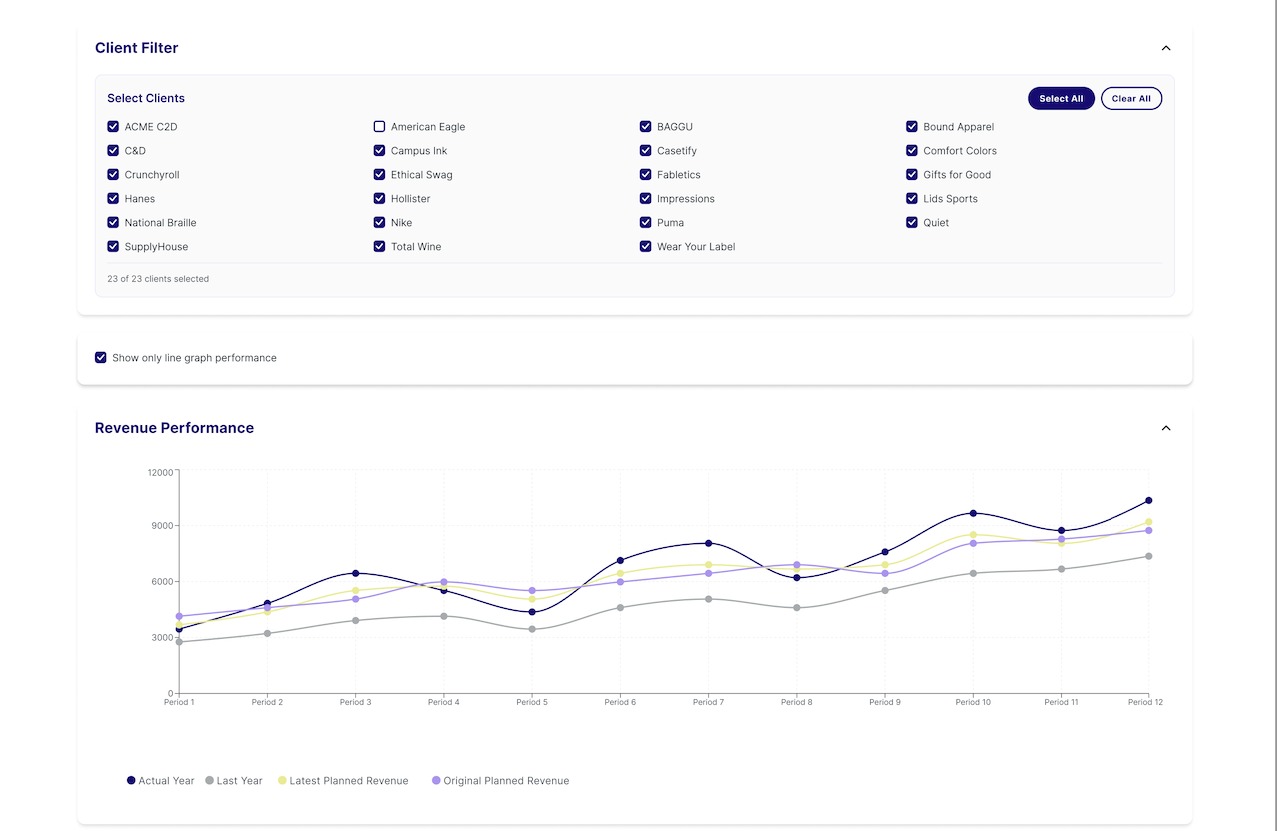
A filter lets you choose which of the 23 partners to include, and the same question Business Profile answered for one partner, how's revenue against plan, gets answered for the whole portfolio.

Portfolio Overview client filter with 23 selectable partners and a Revenue Performance line chart showing actual, last year, and planned revenue across the portfolio

Client filter and aggregate revenue performance across the selected portfolio.

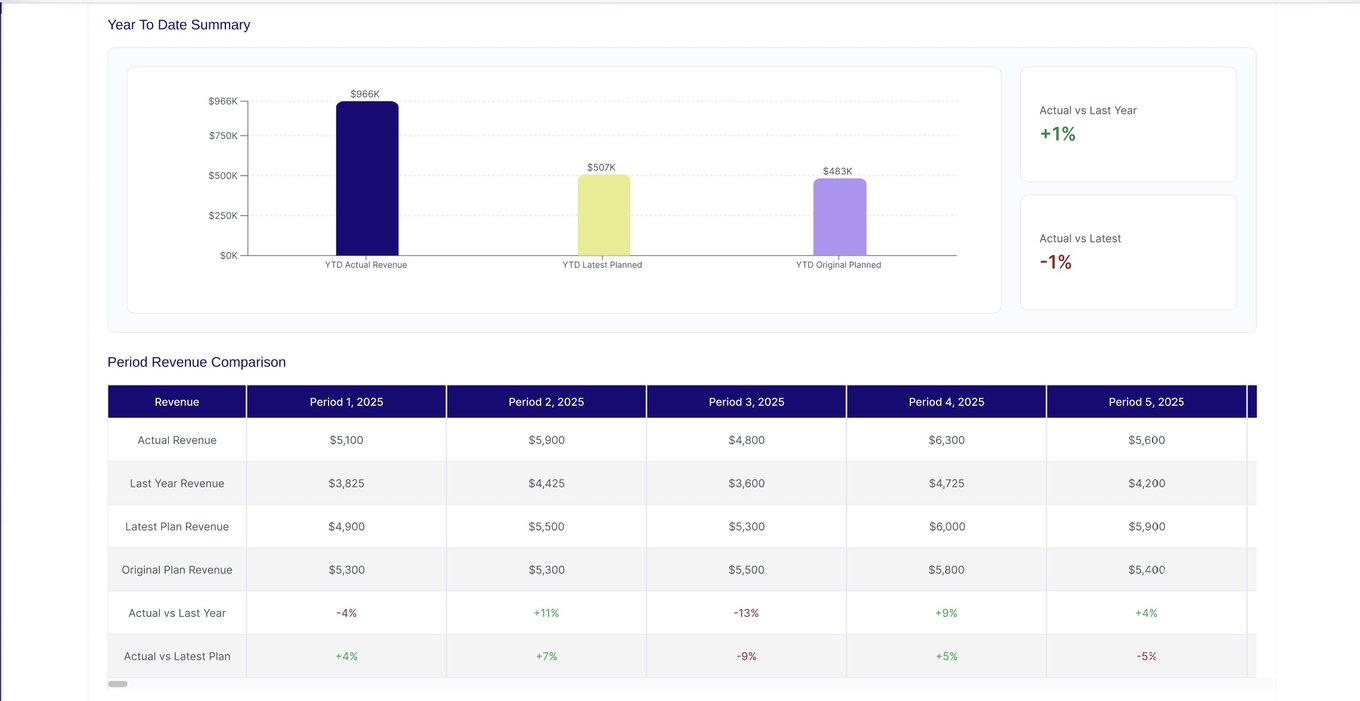
Below each chart, a "Year to Date" summary compares actuals against plan, and a table breaks that comparison down by period. The same pattern repeats for Outbound and Inbound Units.

Year to Date revenue summary bar chart comparing actual, last year, and planned revenue, plus a period-by-period Revenue Comparison table with variance percentages

YTD summary and period-by-period comparison, with the exact variance percentage.

Portfolio Overview closes the arc of the release: it started as one partner's record, and ended up being the reporting layer QP needed, without adding a single new field, just aggregating what Customer Master already had.

15% fewer support tickets. 10% higher internal adoption.

Centralizing partner data meant teams stopped hunting for the same information across four systems. Comparing analytics from the 8–10 weeks after the MVP against the period before, support tickets dropped an estimated 15%, and internal adoption grew an estimated 10%. Both come from real analytics, but they're still an early directional read, not an audited measurement.

15%
Fewer partner-data support tickets
10%
Increase in internal adoption
The map-vs-metrics miss turned into a standing rule for me: test a layout with stakeholders before it goes to high fidelity, never after. Shipping and carrier logic still got defined live, mid-project, instead of locked down with operations earlier, and the outcome numbers still had to be estimated after the fact instead of pulled from real tracking. Those are the two things I'd build in from day one of the next Customer Master, not because this one failed, but because a first full data model for a company always surfaces gaps like these.
Next case study
NAMM Exhibit